Hello. this is Dahee Eo, working as a site reliability engineer (SRE) in the Enablement Engineering team.
Our team plays a role in supporting "Enablement" in various ways to provide LINE services to users with higher performance, efficiency, and safety. Specifically, we are responsible for site reliability engineering for the media platform, as well as tasks related to global server load balancing (GSLB) and content delivery network (CDN), which can be considered the starting point of traffic.
In this article, following Part 1 of Introducing SLI/SLO for Improving Reliability - Introduction and Necessity, I would like to share my experience of defining and applying service level indicator (SLI)/service level objective (SLO) to the media platform in our operations.
Introducing SLI/SLO to a platform, not a service
LY Corporation has a media platform called OBS, which stores, processes, and delivers photos and videos used in LINE and LINE family services. OBS is one of the representative platforms used by most services that use media among many LINE services. For example, all media messages exchanged in LINE app chat rooms use OBS. Therefore, the reliability of this platform is very important, and we decided to define SLI/SLO to provide better quality services to end users.
Most SLI/SLOs are set based on "services". This is because it is easier to measure reliability from the user's perspective based on services rather than the "platform" used within the service. However, in the case of OBS, it is used by about 160 different LINE services, and problems with this platform can directly lead to issues with each service, so we decided to define SLI/SLO separately.
How to define the platform's critical user journey?
Although we started with the background mentioned above, we encountered a wall different from services when setting the critical user journey (CUJ). Detailed explanations about CUJ can be found in Part 1, but for those who are starting with this article, here is a brief explanation:
- The process or flow defined for users to use the service is called "user journey", and the journey for core functions and services within the user journey is called "CUJ".
- Examples of user journeys include "the process users go through to play a video in a video service" or "the flow users go through to send a message" or "the process of adding a friend" in a messaging service.
The platform provides functions through APIs, and it is very difficult and challenging to check how each service uses these in their logic. Therefore, we initially set the main APIs themselves as CUJs and decided to set SLI/SLO for each function.
Among the various functions provided by OBS, I will briefly introduce three main functions in this article.
| API | Description |
|---|---|
| DOWNLOAD | API for downloading objects from CDN or OBS |
| UPLOAD | API for uploading objects to OBS |
| OBJECT_INFO | API for retrieving metadata of objects stored in OBS |
As mentioned in Part 1, metrics that can be used as SLI include availability, throughput, and latency. According to the SLI/SLO measurement principles, we selected one or two SLIs for each CUJ as follows:
| API | SLI |
|---|---|
| DOWNLOAD | Availability (+Throughput) |
| UPLOAD | Availability (+Throughput) |
| OBJECT_INFO | Availability, Latency |
Initially, we also decided to use throughput as an SLI for the DOWNLOAD and UPLOAD APIs, but ultimately excluded it. This was due to the following characteristics of the two APIs:
- The media types are diverse, including audio, files, images, and videos.
- The size of media uploaded/downloaded at once also varies.
Due to these characteristics, there was a significant performance variation by type and size for each service, making it difficult to apply a consistent standard. Therefore, we decided to measure throughput but removed it from the SLI, setting it to be used only as a reference metric.
Collecting SLI/SLO metrics
Collecting SLI/SLO metrics is ideally done at endpoints like API gateways, which are closest to the user as all requests and responses pass through them. However, due to the nature of OBS, it was difficult to collect SLI/SLO-related metrics from the service, so we decided to generate and use the necessary metrics from logs.
The metric collection architecture was designed using Kafka, Vector, and Prometheus as follows:
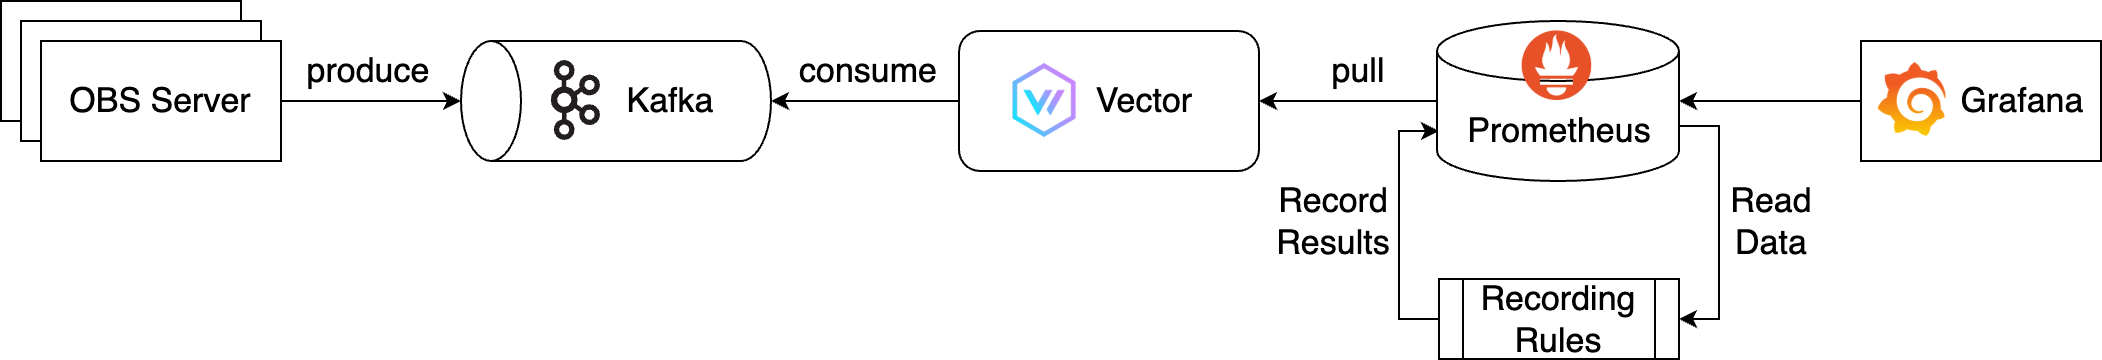
The overall flow of the above architecture is as follows:
- Real-time logs output from OBS servers are sent to Kafka, a message queue, to produce messages.
- OBS has large-scale global servers that handle a very large number of requests and traffic. Accordingly, the amount of real-time logs output is also very large, so Kafka is used to handle this.
- Vector, an observability pipeline, consumes logs produced by Kafka and converts them into metrics needed for SLI/SLO.
- When Vector exports the converted metrics, Prometheus collects and stores them.
- SLI/SLO requires long-term data of more than one month, and since the queries are complex, we optimized performance by applying Recording Rules.
- Finally, this data source is visualized by querying it in Grafana.
The overall flow seems simple, but there were many trials and errors during implementation. I will share two of them.
Too many logs! Vector optimization
The ultimate goal of SLI/SLO is to measure whether users are using the service with trust and without inconvenience. Therefore, it is important to collect metrics in real-time and set up alerts so that if the SLI/SLO and error budget figures fall below the set criteria, the person in charge can respond. However, due to the large amount of logs, about 350TB per day, there was a problem in the process of Vector consuming from Kafka.
For those who are hearing about Vector for the first time, Vector is an open-source project by DataDog, introduced on its homepage as "A lightweight, ultra-fast tool for building observability pipelines". It is responsible for collecting (sources), transforming (transforms), and routing (sinks) all logs, metrics, and traces.
Our team already had a Vector cluster introduced in the previous article Managing Multi-CDN Logs and Traffic with Vector (Article in Korean). We enhanced and expanded this cluster to handle more logs as follows, and increased the number of clusters from one to two for large-scale processing.
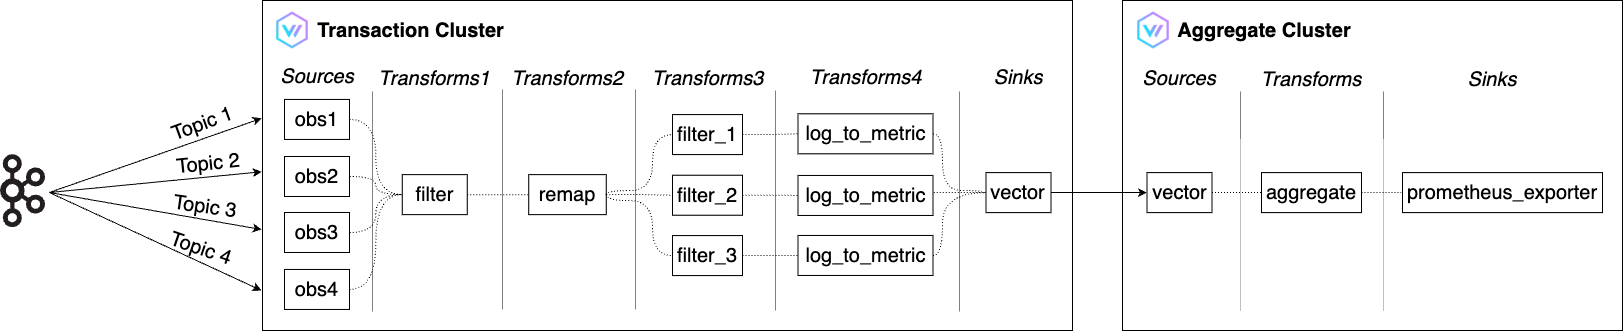
The overall flow of the above architecture is as follows:
- Transaction Cluster
- Use Filter to filter only the logs needed for SLI from the numerous OBS logs received from Kafka.
- Use Remap to transform them into the desired format.
- Use Log to metric to convert them into metrics for measuring availability, throughput, and latency.
- Use one of Vector's Sinks, Vector, to deliver the transformed metrics to the Aggregate Cluster.
- Vector's Sinks are responsible for sending data from Vector to external services.
- Aggregate Cluster
- Use Aggregate to reduce the metric volume received from the Transaction Cluster.
- When prometheus_exporter exports the metrics needed for SLI, Prometheus collects and stores them.
Metric optimization
After optimizing Vector, I thought all preparations for creating the SLI/SLO dashboard were complete as metrics were being generated in real-time without delay. However, this was just my wishful thinking. When querying a week's worth of metrics on the dashboard, it took about a minute to load. This was because the cardinality of the metrics was high, and the PromQL (prometheus query language) was very complex.
To solve this, we applied Recording Rules. Recording Rules is a feature that pre-calculates frequently used or computationally expensive expressions and stores the results as separate metrics. Querying the pre-calculated results is much faster than executing the original expression each time it is needed.
We were able to improve the performance of metric queries by pre-aggregating and storing expressions needed for SLI/SLO and error budgets using Recording Rules. Below is a snippet of the code defining the Recording Rules.
- obs-rules.yaml
groups:
  - name: obs
    rules:
    - record: obs_download_availability
      expr: |
        sum by (service_code, space_id) (rate(obs_client_http_status{api="DOWNLOAD", error_code="null"}[1m]))
        /
        sum by (service_code, space_id) (rate(obs_client_http_status{api="DOWNLOAD"}[1m]))
    - record: obs_download_throughput_p50
      expr: |
        histogram_quantile(0.50, sum by(le, service_code, space_id) (rate(obs_client_http_throughput_summary_bucket{api="DOWNLOAD""}[1m])))
    - record: obs_download_throughput_p90
      expr: |
        histogram_quantile(0.90, sum by(le, service_code, space_id) (rate(obs_client_http_throughput_summary_bucket{api="DOWNLOAD"}[1m])))
    - record: obs_download_throughput_p99
      expr: |
        histogram_quantile(0.99, sum by(le, service_code, space_id) (rate(obs_client_http_throughput_summary_bucket{api="DOWNLOAD"}[1m])))
    # ... truncated ...
    - record: obs_object_info_latency_p50
      expr: |
        histogram_quantile(0.50, sum by(le, service_code, space_id) (rate(obs_client_http_duration_seconds_bucket{api="OBJECT_INFO"}[1m])))
    - record: obs_object_info_latency_p90
      expr: |
        histogram_quantile(0.90, sum by(le, service_code, space_id) (rate(obs_client_http_duration_seconds_bucket{api="OBJECT_INFO"}[1m])))
    - record: obs_object_info_latency_p99
      expr: |
        histogram_quantile(0.99, sum by(le, service_code, space_id) (rate(obs_client_http_duration_seconds_bucket{api="OBJECT_INFO"}[1m])))
Metrics with Recording Rules applied are broadly categorized into three:
- Availability
- Availability is calculated as
(number of successful requests / total number of requests) x 100%. - This calculation is applied to metrics generated through Vector.
- Availability is calculated as
- Throughput
- Throughput is generated as a histogram type in Vector's log_to_metric.
- We calculate and apply the 50th percentile, 90th percentile, and 99th percentile.
- Latency
- Latency is generated similarly to throughput as a histogram type in Vector's log_to_metric.
- We calculate and apply the 50th percentile, 90th percentile, and 99th percentile.
Below is an example of PromQL used for error budget calculation before and after applying Recording Rules. You can see that the PromQL has become much simpler after applying Recording Rules. In addition to readability, using pre-calculated metrics also improved query retrieval performance.
- Before applying Recording Rules
(($slo_period*24*60*(1-$slo_object_availability)) - ( count_over_time( ( ( ( sum(rate(obs_client_http_status{api="DOWNLOAD", service_code=~"$service_code", space_id=~"$space_id", error_code="null"}[$__interval])) / sum(rate(obs_client_http_status{api="DOWNLOAD", service_code=~"$service_code", space_id=~"$space_id"}[$__interval])) ) ) < ($sli_criterion_availability / 100) )[${slo_period}d:1m] ) or on() vector(0) ) - After applying Recording Rules
(($slo_period*24*60*(1-$slo_object_availability))
-
(
  (count_over_time((obs_download_availability{service_code=~"$service_code", space_id=~"$space_id"} < ($sli_criterion_availability / 100))[${slo_period}d:1m]))
  or on() vector(0)
))
How to use SLI/SLO
We created summary and detailed dashboards for each CUJ using the implemented metrics as follows:
| SLI Summary | OBJECT_INFO CUJ |
|---|---|
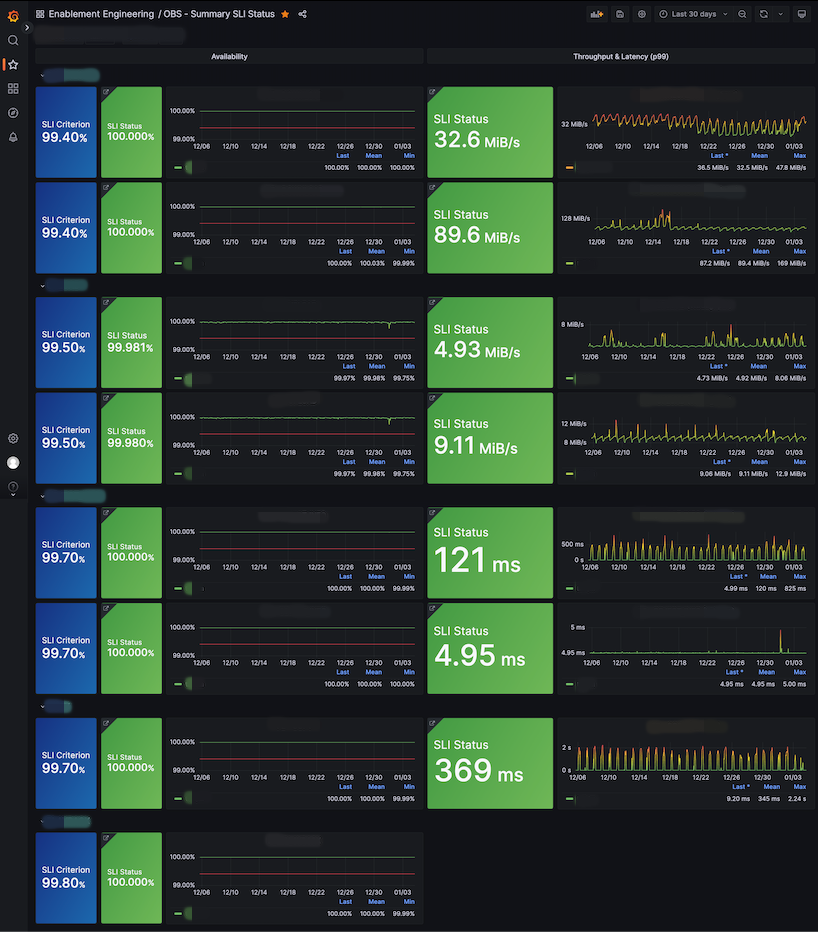 | 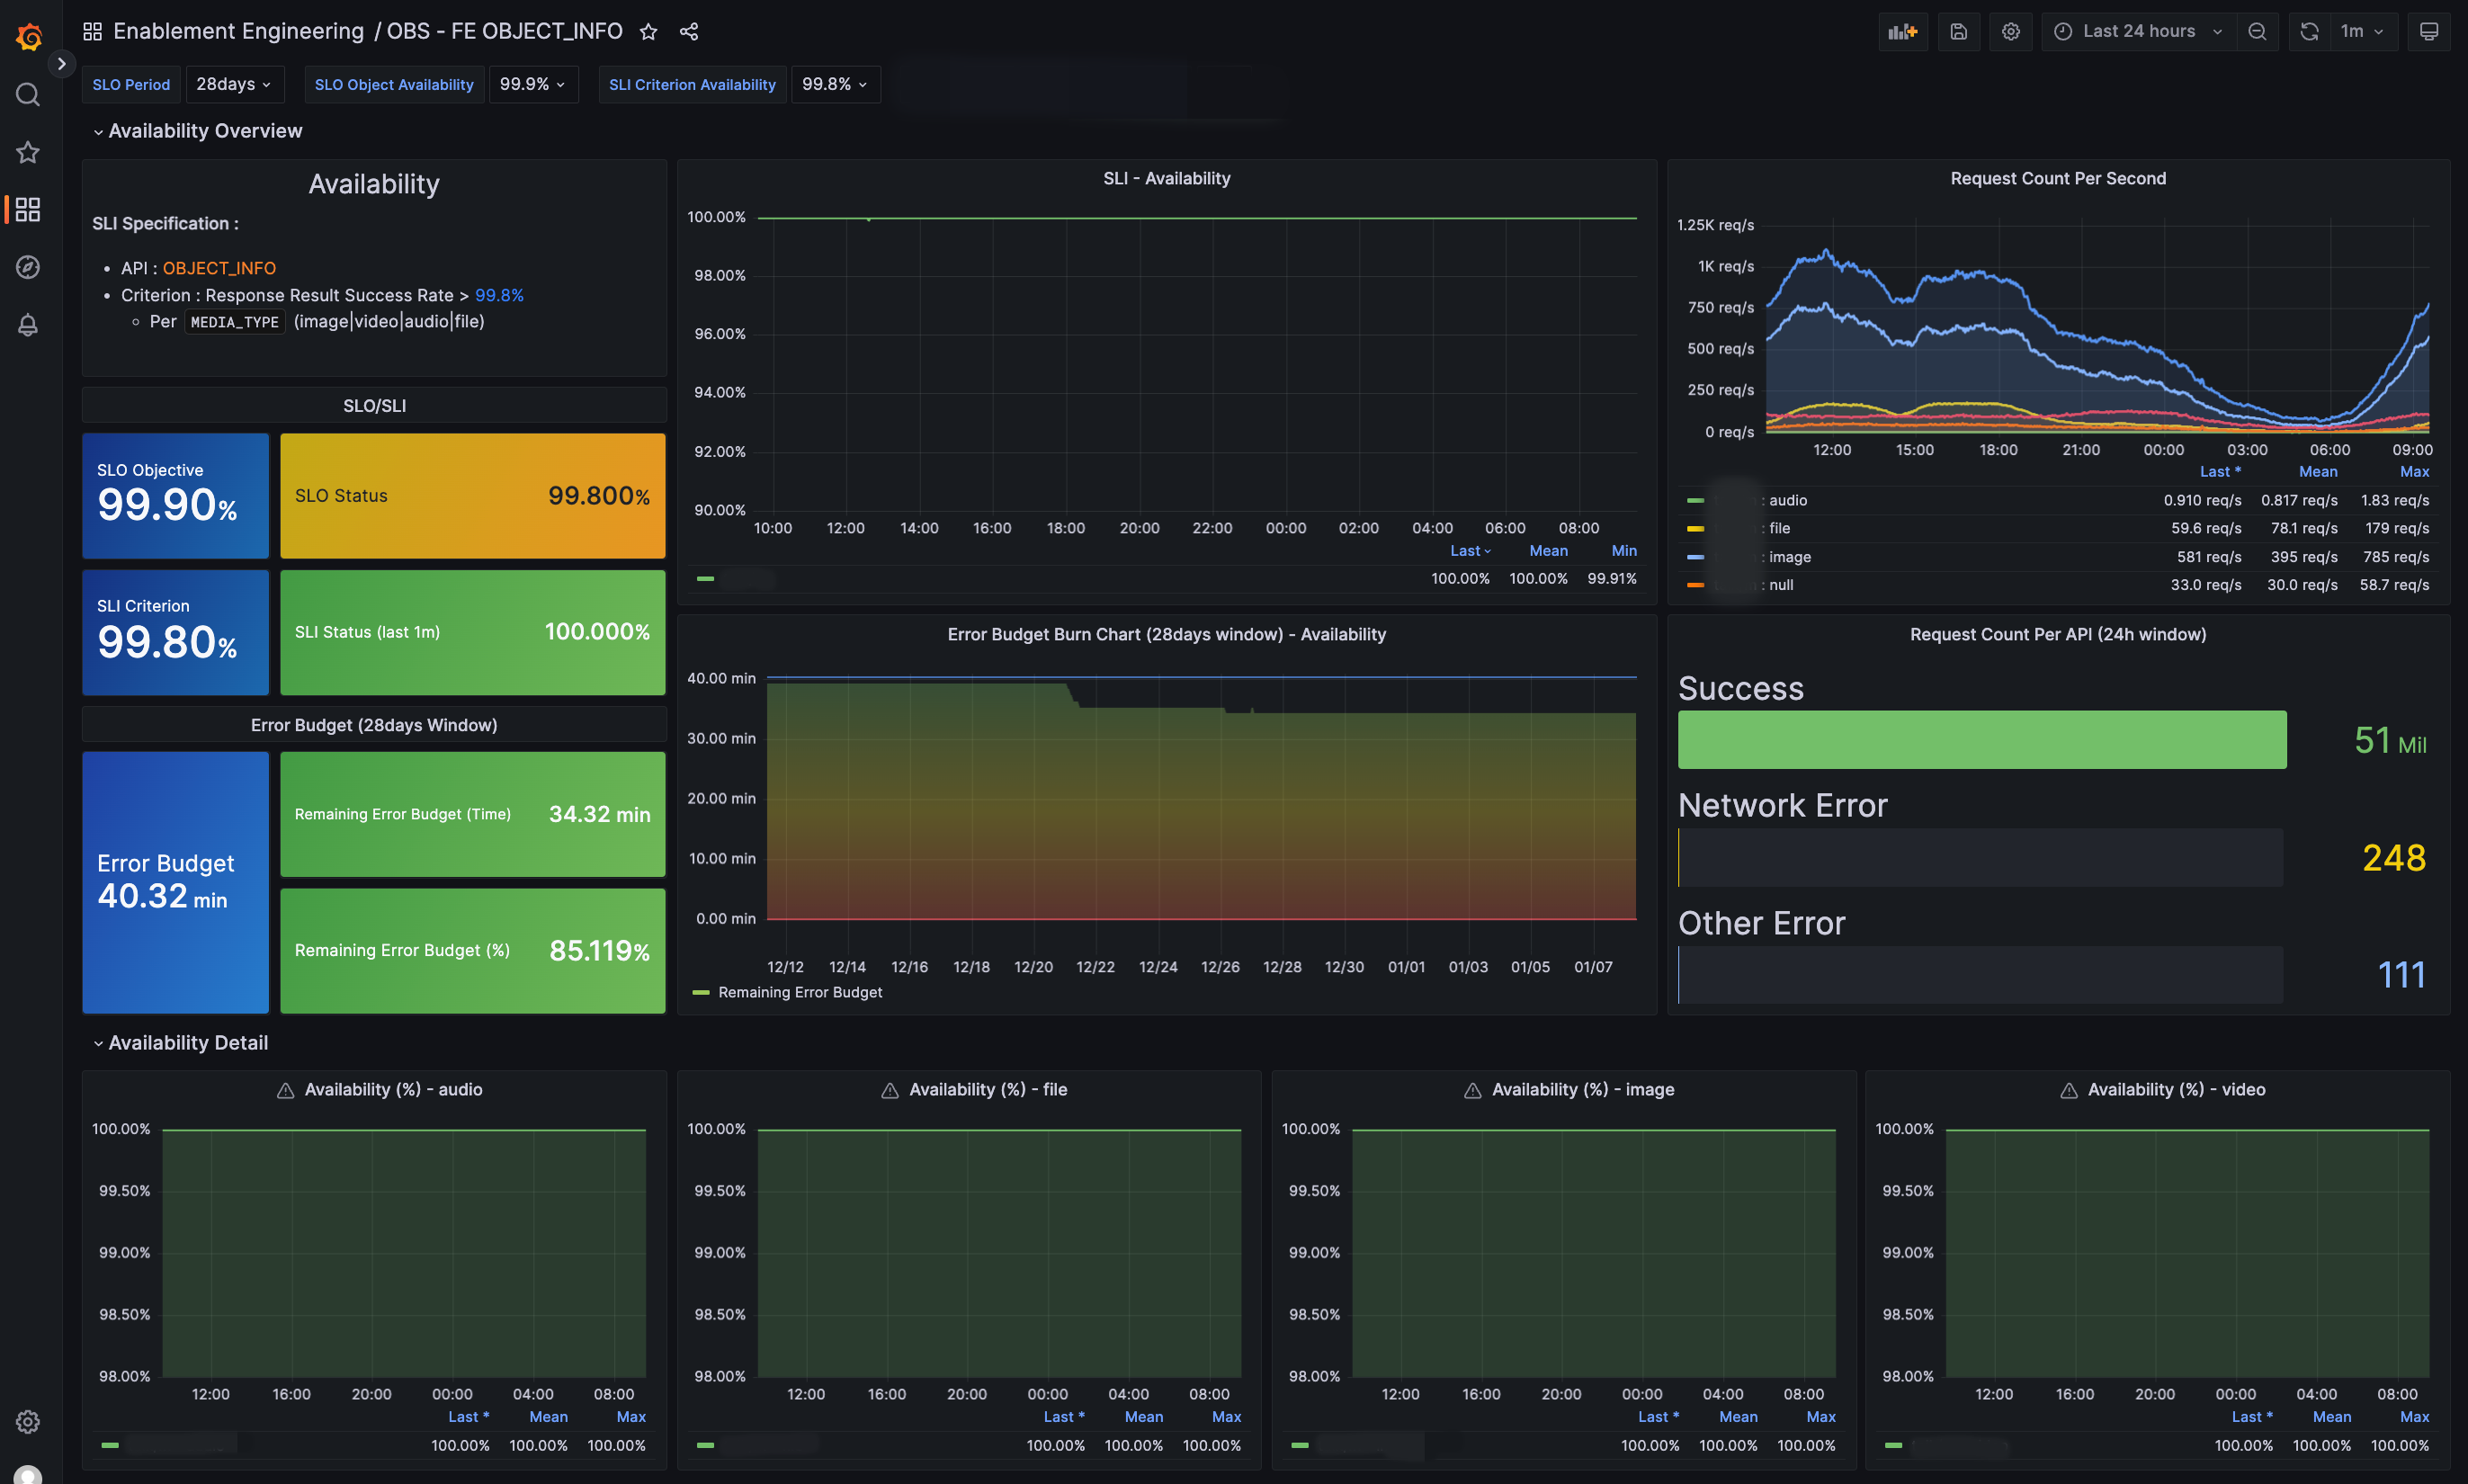 |
In the SLI summary dashboard, you can quickly identify if there are any anomalies in the current service, and in the detailed dashboard for each CUJ, you can check not only SLI/SLO/error budgets but also requests and errors in more detail.
We have set up alerts according to the targeted SLO for each CUJ, so even in situations where the platform is used by various services, we can identify which service and function users are experiencing inconvenience with.
Alerts are linked with Slack, and we have set it up so that even without entering the dashboard, you can check the situation with a captured panel in the thread comments.
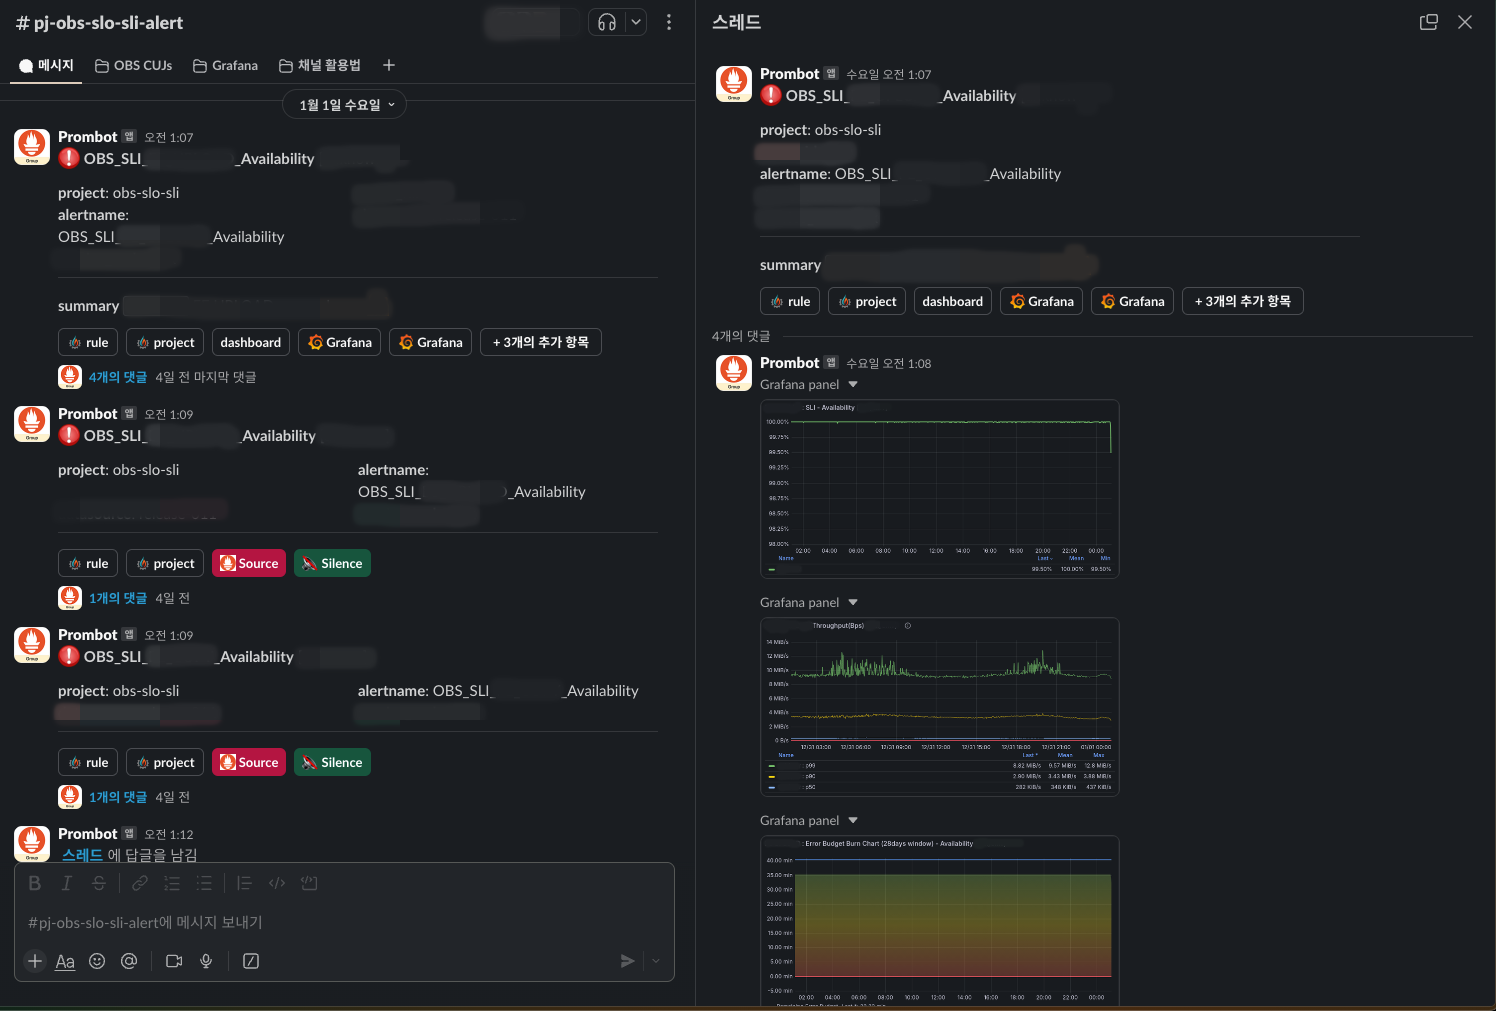
If an alert occurs and the error budget continues to decrease, you must immediately find and resolve the cause of the problem, but if the error budget is within the allowable range, you can choose the level of response by judging the urgency. This can greatly help reduce operational fatigue. In the longer term, depending on the state of the error budget, you can decide whether to focus more on developing new features or on stability.
Future directions
Future directions can be divided into two aspects: "OBS SLI/SLO aspect" and "media platform SRE aspect", which is the role of my team.
In terms of OBS SLI/SLO, the current state is that we have defined OBS's own SLI/SLO, but it has not yet been shared with the services using the platform. Therefore, in the future, we aim to inform the services using the platform and utilize it together to provide more reliable services to users.
In terms of media platform SRE, it is about applying SLI/SLO to various media platforms other than OBS. By applying it not only to one platform but also to various services and platforms within LY Corporation, we aim to move towards a direction where we can talk about the reliability of LY Corporation services in a common language.
Conclusion
This project was an opportunity to reflect on the role of SRE by thinking from the user's perspective and to reaffirm my commitment. In addition, by expanding the Vector cluster introduced in Managing Multi-CDN Logs and Traffic with Vector and applying it to CDN and OBS, we were able to accumulate a lot of related know-how.
We are applying and advancing SLI/SLO to various platforms and services other than OBS. I hope this article will be helpful to many SREs, and I will conclude here. Thank you for reading this long article.