The original article was published on March 27, 2025.
In recent years, generative models have emerged as innovative tools in the field of artificial intelligence, garnering significant interest from researchers and industry leaders. Based on advancements in deep learning technology, generative models have demonstrated unprecedented capabilities in generating complex data formats such as high-quality images and videos. With the advent of new architectures like generative adversarial networks (GANs), variational autoencoders (VAEs), and diffusion models, generative technology is rapidly expanding beyond academic exploration to practical applications in the industry. These advancements have opened new possibilities in creative industries such as entertainment, advertising, and content creation, as well as driving significant progress in various fields like scientific simulations, virtual environments, and augmented reality.
However, unlike traditional machine learning techniques, generative models face the limitation of being very difficult to quantitatively evaluate due to the lack of ground truth for the generated outputs. Since results can be generated and expressed in various forms, it cannot be assumed that they must be generated exactly like a single correct answer. Although alternative evaluation metrics such as Fréchet inception distance (FID), inception score (IS), and CLIPScore are used to evaluate the quality of generative models, these metrics also fall short of fully reflecting all aspects of model performance.
In this article, we will take a detailed look at various methods for evaluating the outputs generated by vision generative models such as FID and IS, and explore what considerations should be made when applying generative models to real applications.
What are the performance evaluation methods for vision models?
Before discussing the evaluation methods for image generative models, let's first examine the classical vision tasks and the methods for evaluating the performance of vision models in solving these tasks to establish clearer and more understandable criteria. This will help us better understand the context of the model performance evaluation problem.
The methods for evaluating the performance of vision models can be broadly divided into qualitative and quantitative methods. Qualitative methods involve reviewing the outputs based on subjective criteria to express performance. While this method can reflect subtle quality differences that quantitative evaluations cannot capture, it is difficult to ensure consistency as results may vary depending on individual criteria. Moreover, it requires significant time and cost as it involves direct human verification.
In contrast, quantitative methods create consistent evaluation criteria to objectively evaluate model performance using metrics and numbers. Although this method has the disadvantage of being unable to consider aspects that cannot be expressed numerically, it offers the advantage of consistent results, making it easy to compare models and efficiently evaluate their performance.
Thanks to these advantages, quantitative evaluation methods are currently used in various classical vision tasks. Let's take a closer look at quantitative evaluation methods.
Types of vision models and their performance evaluation methods
Major tasks in the traditional computer vision field include image classification, detection, and segmentation. These areas have predetermined ground truths (GT), making it relatively easy to create datasets for quantitative evaluation. Let's examine some real-world examples.
Image classification
Image classification is the problem of classifying which class a given image belongs to. As shown in the following figure, in the case of image classification, GT annotation is performed to predetermine which class each image belongs to among the classes defined in the task. The model then predicts the images in the dataset and checks whether the predictions match the ground truth to indicate the model's performance. In the case below, the accuracy is approximately 66.6% as two out of three test cases are correct.
| Input | GT | Prediction | Result |
|---|---|---|---|
 | Angry | Angry | O |
 | Happy | Happy | O |
 | Neutral | Happy | X |
Object detection
Object detection is the problem of finding the location of target objects in a given image. Unlike image classification, detection involves not only determining whether an image contains a specific object but also identifying where the object is located. Due to this difference, in detection tasks, the evaluation criteria are set by recording the ground truth objects and their locations in the form of "bounding boxes" and comparing the model's predictions with these.
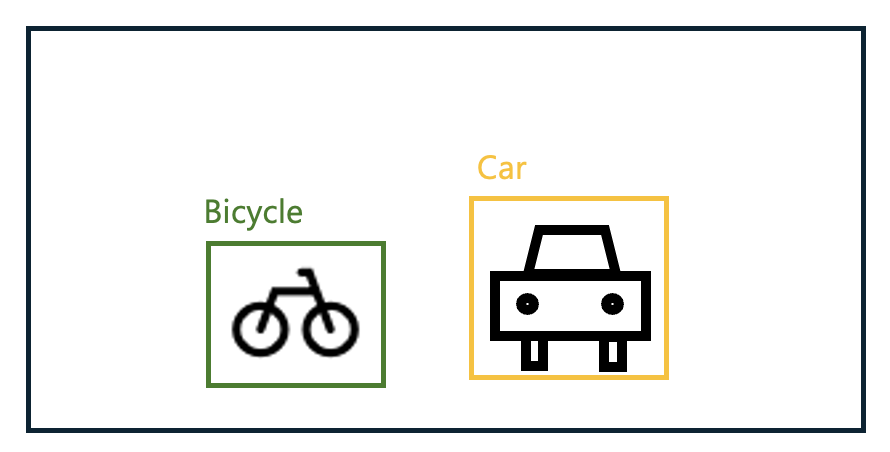
In detection, evaluation methods such as "mAP@[ IoU=0.50 ]" or "mAP@[ IoU=0.50:0.95 ]" are commonly used based on the GT in the form of the above figure. This method measures the mean average precision (mAP) at a specific ground truth criterion (intersection of union, IoU). Let's take a closer look at mAP and IoU.
mAP
mAP stands for "mean average precision" and can be calculated by averaging the average precision for each class and then averaging these values as shown in the following formula.

In the above formula, C is the number of classes, and APc is the AP of the c-th class. So how can AP be calculated? To calculate AP, we first need to know precision and recall.
- Precision
- Recall
- True positive (TP): Correctly predicted positive (count)
- False positive (FP): Negative incorrectly predicted as positive (count)
- False negative (FN): Positive incorrectly predicted as negative (count)
Here, precision according to recall can be represented as a PR-Graph as shown in the following figure.
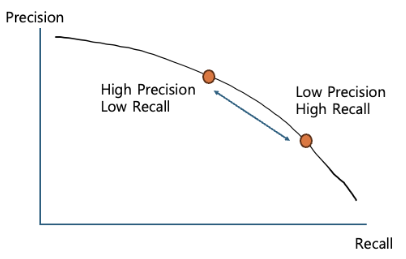
The AP used in object detection is the area (integral value) of this graph. Why is such a complex method used to measure performance in detection?
Determining whether a specific class is "detected" or not is a binary classification problem. In this case, a threshold must be determined to decide at what point the classifier's prediction for a specific class is considered successful. Generally, precision and recall have a trade-off relationship. When one increases, the other decreases. In other words, setting a low threshold ensures high recall and low precision, while setting a high threshold results in the opposite.
Therefore, to also examine the stability of the detection model, precision is calculated by setting multiple thresholds instead of just one, and performance is evaluated based on the average of these values. Since integrating the PR-Graph is difficult, it is generally simplified using techniques such as "11-point interpolation" (calculating precision at 11 evenly divided recall positions and then averaging).
IoU
Next, let's learn about IoU. In the example of the Bicycle class below, there is a green line box (GT) and a red line box (prediction), with a yellow box where the two boxes overlap. Let's call each area G, R, and Y.

IoU can be calculated as follows:
- IoU = Y / (G + R - Y)
In other words, IoU is the ratio of the intersection area to the union area between the GT and the predicted box. If the prediction exactly matches the GT, the IoU will be 1, and if they do not overlap at all, it will be 0.
mAP@[IoU]
Now that we understand the concepts of mAP and IoU, let's interpret the meaning of mAP@[ IoU=0.50 ] and mAP@[ IoU=0.50:0.95 ].
- mAP@[ IoU=0.50 ] calculates mAP by considering predictions with an IoU of 0.5 or higher as found.
- mAP@[ IoU=0.50:0.95 ] calculates mAP by increasing the IoU criterion from 0.5 to 0.95 in increments of 0.05 and then averaging the results.
mAP@[IoU] is currently the most widely used evaluation method in object detection tasks.
Image segmentation
Image segmentation is the method of segmenting each object within a given image. It involves finding the outlines of each object and can be seen as an advanced form of object detection.
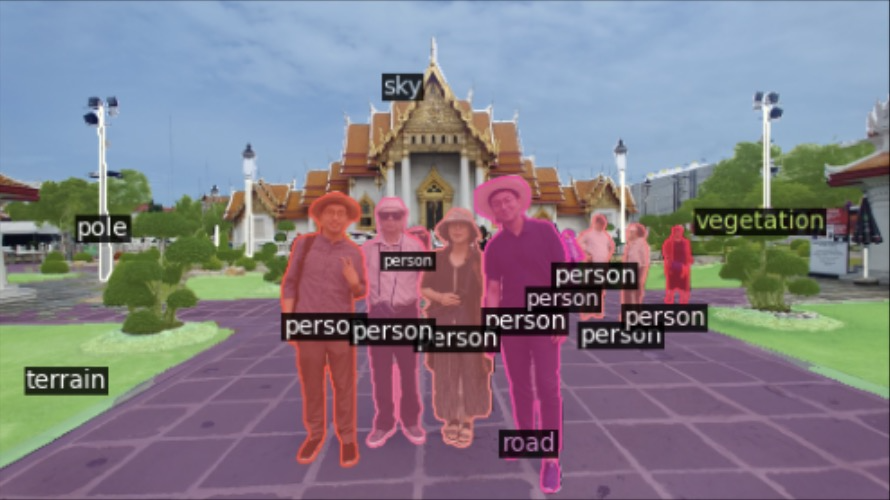
When evaluating image segmentation, the "mIoU" method is generally used, which calculates the IoU for all classes and then averages the values.
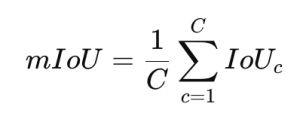
In the above formula, C is the number of classes, and IoUc is the IoU of the c-th class.
In addition to mIoU, methods such as "boundary IoU" for more precise evaluation of boundary areas or "pixel accuracy", which calculates the ratio of correctly classified pixels among all pixels for simpler evaluation, are also used depending on the purpose.
Evaluation methods for image generative models
Why evaluation methods in generative models are special
As seen earlier, traditional vision models could measure performance relatively accurately with given ground truths (GT). But what about generative models? Generative models create actual images from given conditions (such as text prompts). However, the generated images often do not exist in the training data.
For example, consider the following images. The following images were generated using the prompt "Draw a man holding a tennis racket in LINE style," requesting a drawing that feels like the illustrations used by our company (reference).

Which of the two images above is better? Is the right image better because the man is holding two rackets? It seems that the evaluation may vary depending on personal preference. In reality, there can be countless possible cases that satisfy a given prompt, and some may not exist at all. (For example, "Draw an elephant flying through space".)
Therefore, assigning GT for evaluation or selecting a target for comparison is very difficult. For this reason, generative models generally apply different criteria than traditional methods when evaluating generated outputs.
The most commonly used criteria are visual quality, realism, and prompt alignment. Recently, AI safety elements such as fairness and toxicity have also been included in the evaluation content.
These cannot be replaced by any of the existing evaluation methods in the vision field. Therefore, new methods had to be proposed to evaluate generative models. In the next section, we will explore methods for evaluating generative models in earnest.
Methods for evaluating visual quality
Methods for evaluating the visual quality of generated outputs can be divided into image processing-based quality evaluation methods and methods that use machine learning to predict visual quality. Let's examine each type of evaluation method and identify their advantages and disadvantages.
Image processing-based evaluation methods
Image processing-based evaluation methods include PSNR and SSIM. Let's look at each one.
PSNR (peak signal-to-noise ratio)
PSNR is one of the most representative quality evaluation methods, meaning "peak signal-to-noise ratio". A higher value indicates better performance, and it is calculated as follows.

In the above formula, MAXI represents the maximum signal value, typically 255. MSE is the mean square error, calculated as follows.
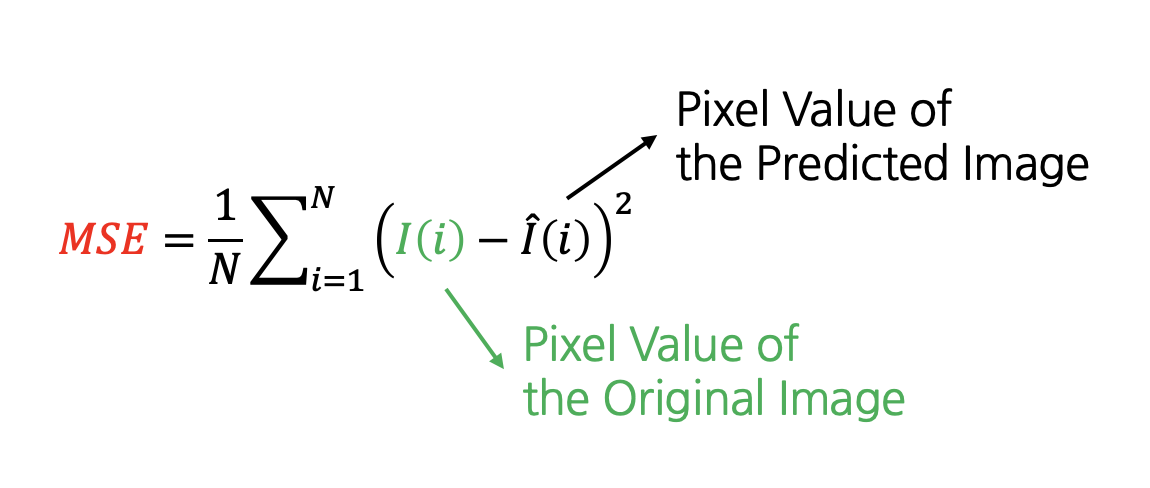
In the above formula, N represents the number of pixels in the image, and I(i) represents the i-th pixel value. Since the difference in pixel values between the original and predicted images is evaluated through squaring, a significant difference in a specific area is considered worse quality than slight differences across the entire image.
Quality evaluation using PSNR requires the original image, and since it indicates how similar the image is to the original, a high PSNR does not necessarily guarantee good quality. For example, if contrast enhancement or color correction is performed on the original image, the PSNR will change as the image becomes increasingly different from the original, but the perceived quality may improve.
Therefore, this evaluation method is mainly used to measure the restoration capability of compressed images and can be used in a limited way in fields like inpainting to evaluate whether specific parts are generated similarly to the original.
SSIM (structural similarity index map)
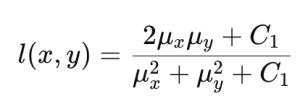
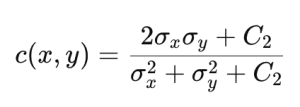
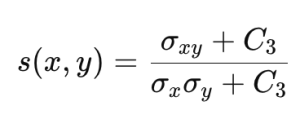
SSIM was proposed to complement the shortcomings of PSNR and better reflect the human visual system. SSIM calculates the brightness, contrast, and structural similarity between the original and predicted images as follows.
| Brightness | Contrast | Structure |
|---|---|---|
|
|
|
|
In the above formula, Ci is a constant for calculation stability. Using this, SSIM is calculated as follows.

Generally, is used. Although SSIM is designed to better reflect the concept of quality as perceived by humans, like PSNR, it requires the original image, so it can only be used in a limited way for evaluating generative models.
Machine learning-based model evaluation methods
Machine learning-based model evaluation methods include IS, FID, LPIPS, Aesthetic Score, CLIPIQA, and Q-ALIGN. Let's look at each one.
IS (inception score)
IS was introduced in the 2016 technical report Improved Techniques for Training GANs and is named "inception score" because it uses the Inception v3 classifier.
This method operates on the assumption that "a well-trained model will generate images whose contents can be easily identified by a machine learning model". In other words, if the Inception v3 classifier can confidently classify the result included in a given image, it is interpreted as meaning that the input image clearly possesses the characteristics of a specific class, leading to the conclusion that it is a good generative model (here, "confidently classifying a specific class" is judged by whether the "confidence score" is high or low).
The formula for calculating IS is as follows.
![]()
The conditional probability p(y∣x) represents the probability that each image x belongs to class y. A good model will map input images to specific classes, so the entropy of this conditional probability will be low. p(y) represents the distribution of classes. The more diverse the image set, the more uniform the distribution of p(y) will be.
The similarity between these two distributions is compared using Kullback–Leibler divergence (KLD). The KLD value is higher when the image clearly belongs to a specific class and when the class distribution is uniform. The average KLD is calculated, and the IS is obtained by applying the exponential function to this average.
Although IS was widely used in the early development of generative models, its usage has decreased significantly after the introduction of algorithms like FID, which will be explained next, due to the following disadvantages.
- Only considers the overall class distribution in the calculation formula, not the distribution within classes
- The class characteristics judged by the classifier model may not match human criteria
- It is difficult to apply when generating classes not included in the pre-trained classifier
FID (Fréchet inception distance)
This method, introduced in the paper GANs Trained by a Two Time-Scale Update Rule Converge to a Local Nash Equilibrium, is a metric designed to evaluate the quality and diversity of images generated by generative models. It measures the difference between the distribution of generated images and real images using the Frechet distance to evaluate the model's performance.
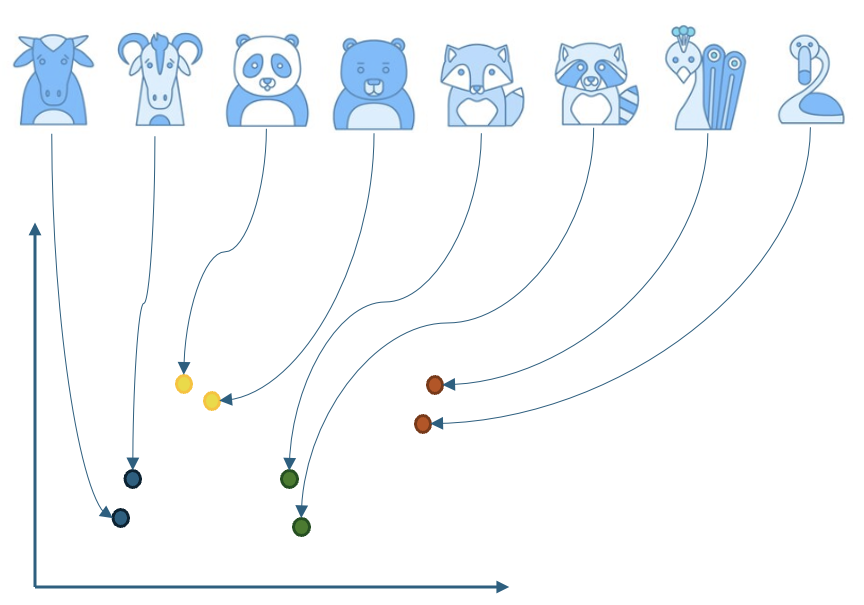
To measure FID, an image embedder is first used to extract feature vectors from the input images. These feature vectors represent the image information expressed in high dimensions in a reduced form.
Let's look at an example of expressing various animal images in 2D as shown below. The image embedder learns the similarities and differences between images during training and maps similar-looking animals to similar locations and different-looking animals to different locations.
Now, let's think of this as general images and generated images instead of each animal's class, as shown in the figure below. If the generated images are well generated to resemble existing images, they will be distributed in similar locations. If there are many differences due to distortion, they will be distributed in different locations, like the light green area in the figure below.
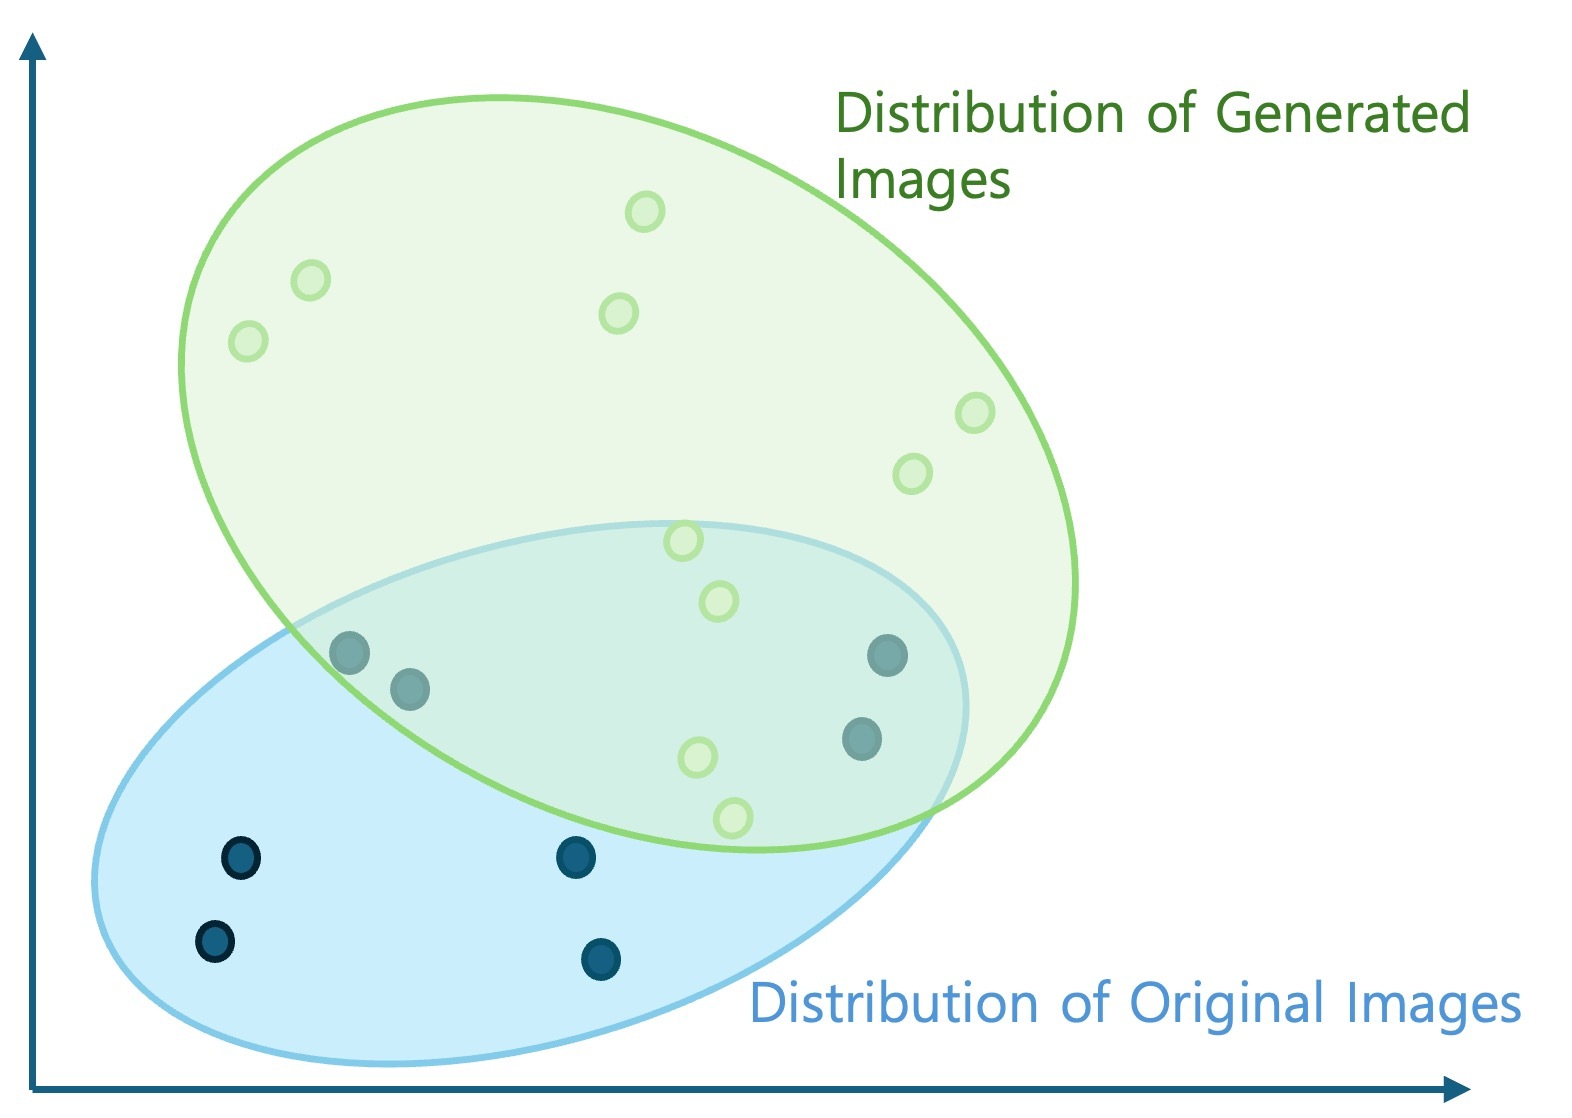
Let's take a closer look at how to calculate the distribution similarity between general images and generated images. To do this, we first need to model the distribution of the extracted feature vectors. Let's assume they follow a multivariate normal distribution. Based on this assumption, we calculate the mean vector (μ) and covariance matrix (Σ) of each distribution and use them to calculate the Fréchet distance (or Wasserstein-2 distance) between the two normal distributions using the following formula.
![]()
Here, ||·||² is the square of the L2 norm of the vector, and Tr is the trace (sum of diagonal elements) of the matrix. As seen in the formula, FID is the difference between the two distributions, so the lower the FID value, the more similar the generated image distribution is to the real image distribution. Therefore, a low value indicates that the model has learned the characteristics of real data well and generates high-quality images, while a high value indicates that the quality of the generated images is low or lacks diversity.
The advantage of FID is that it directly compares the distribution of generated images with real images, allowing for the evaluation of how well the model reproduces the characteristics of real data. It also considers both the quality and diversity of images to evaluate the overall performance of the generative model. The disadvantage is that FID measures the performance of the generative model itself rather than directly measuring the quality of the generated images. Additionally, since the image embedder relies on pre-trained models like the Inception network, accurate evaluation may be difficult if the dataset to be evaluated differs significantly from the training data of these models. Furthermore, although it assumes that the feature vectors follow a normal distribution, actual data may not always satisfy this assumption.
FID is currently a widely used metric for evaluating the performance of generative models, especially for models like GANs. However, it is recommended to use FID in conjunction with other evaluation metrics, as it has limitations in fully evaluating model performance based solely on FID values.
For reference, the FD-DINO method, which replaces the image embedder in the existing FID method with the higher-performance DINO v2-ViT-L/14, has also been introduced. DINO v2-ViT-L/14 offers richer image representation than the Inception v3 model, which was trained for classification tasks, due to its unsupervised learning. Additionally, as a vision transformer-based technique, it can more effectively represent both global and local characteristics of images. Its larger model size and the larger amount of data used for training allow for more precise quality evaluation than existing techniques.
LPIPS (learned perceptual image patch similarity)
Next is LPIPS, introduced in the paper The Unreasonable Effectiveness of Deep Features as a Perceptual Metric. LPIPS evaluates the quality of generated images by extracting embeddings of the original and generated images, mapping them to the feature space, and calculating the distance between them in the feature space. The two images to be compared are input into the VGG (Visual Geometry Group) network pre-trained on ImageNet data, and feature values are extracted from intermediate layers to measure the Euclidean distance between the features as follows.

Here, is the weight for the l-th layer, and is the feature value at position (h, w) of the l-th layer.
If LPIPS is applied to general image generation tasks, selecting the original image to compare with the generated image becomes a problem. This is because there is no image that can be judged as the original for the generated image. Therefore, it is generally used in cases where pairs of original and generated images exist. (For example, image reconstruction, image super-resolution, image inpainting) In other cases, the most similar real image from the training data can be used, or the results of a generative model known to be of higher performance can be used.
Aesthetic score
The aesthetic score is an evaluation method that uses a model trained on datasets like LAION-Aesthetics V1 provided by LAION (Large-scale Artificial Intelligence Open Network, a non-profit organization aiming to democratize artificial intelligence through large-scale open datasets and AI research) to evaluate the quality of generated images. This dataset measures image quality by asking people to rate 5,000 diverse images from the SAC Dataset as follows.
- "Please rate how much you like this image on a scale of 1 to 10."
The input image is then converted into image features using the OpenAI CLIP ViT-L/14 model, and a linear model is trained to produce results between 1 and 10. Therefore, this method allows for quality evaluation similar to human perception and is increasingly used in recent image generation model evaluations. Aesthetic Score-v2, which enhances performance by constructing a richer dataset using the SAC Dataset with an additional 176,000 images and LAION-Logos, has also been released.
CLIPIQA
CLIPIQA (CLIP image quality assessment), introduced in the paper Exploring CLIP for Assessing the Look and Feel of Images, is a method for evaluating image quality using the CLIP model. Unlike traditional image quality evaluation methods, CLIPIQA is designed to evaluate the visual quality of images more closely aligned with human subjective judgment.
This method calculates the feature vector of the evaluation target image using the CLIP image embedder and measures the similarity with embeddings of contrasting evaluations such as "This is a high-quality image" and "This image has a lot of noise". Therefore, like the Aesthetic Score, this method also has the advantage of being able to evaluate a single generated image without a comparison target.
Q-ALIGN
Proposed in the paper Q-ALIGN: Teaching LMMs for Visual Scoring via Discrete Text-Defined Levels, this method trains a large multimodal model (LMM) to measure image quality, aesthetic assessment, or video quality. For example, if the quality of a given image is poor, it generates GT such as "The quality of the image is poor", and during training, it ensures that the response to queries like "Can you evaluate the quality of the image?" matches the given GT.
This method uses sentence-defined evaluation levels instead of numbers for training, allowing it to fully leverage the capabilities of existing LLMs, resulting in better evaluation performance compared to previous methods. Additionally, like the Aesthetic Score and CLIPIQA, this method is convenient to use as it can evaluate each image individually.
Prompt alignment
The methods explained earlier evaluate the quality of generated images. However, since generative models must faithfully reflect the prompts used for generation, prompt alignment should also be evaluated.
CLIP Score
This is the most widely used basic evaluation method. It uses the CLIP image embedder and text embedder to map the generated image and generation prompt to the feature space, respectively, and measures their similarity using cosine similarity as follows.

Here, A⋅B is the dot product of the two vectors, and ∥∥ is the L2 norm of the vector. If the two values are similar, 1 is output, and if they are different (orthogonal), 0 is output.
QA (question-answering) technique
QA refers to the task of sending a question to a specific language model and receiving a generated answer. It is used to evaluate whether the content of the prompt is actually generated.
VQA (visual-question-answering) Score
The paper Evaluating Text-to-Visual Generation with Image-to-Text Generation evaluates alignment using the VQA method with prompts like the following.
- "Does this figure show {Prompt}?"
The model used is CLIP-FlanT5, and it is retrained using publicly available VQA datasets to evaluate the alignment of pre-trained models. It has been shown to evaluate more similarly to humans than other methods in the GenAI-Bench benchmark, which includes complex text prompts containing 1,600 places, objects, attributes, and relationships.
Gecko Score
Proposed in the paper Revisiting Text-to-Image Evaluation with Gecko: On Metrics, Prompts, and Human Ratings, this method examines whether the content of the prompt is faithfully reflected in the generated image through questions, similar to the VQA Score. For example, if the input prompt is "a cartoon cat in a professor outfit, ...," the LLM model is used to extract the main keywords of the prompt. In this case, it can be assumed that keywords like cartoon, cat, and professor outfit are extracted. Then, QA is generated based on this. In other words, the following QA pairs are generated, and the actual alignment is evaluated based on them.
- Q: "Is there a cat?", A: "[Yes, no]"
- Q: "Is the cat a cartoon?", A: "[Yes, no]"
Simultaneous evaluation of image quality and prompt alignment
Both image quality and prompt alignment are important factors in evaluating generated images. Therefore, many methods have been proposed to evaluate images from both perspectives simultaneously.
HPS-V2
The paper Human Preference Score v2: A Solid Benchmark for Evaluating Human Preferences of Text-to-Image Synthesis provides a large-scale dataset called Human Preference Dataset v2, which represents human preferences for images. This dataset includes approximately 800,000 images (about 400,000 pairs), with the preferred image indicated for each pair. By retraining the CLIP model based on this dataset, a model called HPS v2 (Human Preference Score v2) can be obtained, which well represents human preferences.
For example, let's say there is an image pair {x1, x2}. If the preferred image among x1 and x2 is x1, it can be represented as y=[1, 0] (in the opposite case, y=[0, 1]).

In the above formula, p and x are the prompt for generating the image and the generated image, respectively. τ is the "temperature scalar" value of the CLIP model, and θ is the parameter of the CLIP model. Here, the temperature scalar value is the weight for the similarity between the prompt and the image. It is usually assigned a value of 1 or higher, and the higher the value, the less the influence of the similarity difference between the prompt and the image is reflected. Enc() is the text and image encoder functions, respectively. Training is conducted using the following KL-Divergence loss function to minimize.

At this time, can be obtained through the following formula.

In other words, the image with relatively lower quality among {x1, x2} is trained to be considered unrelated to the given prompt.
Pick score
The method proposed in the paper Pick-a-Pic: An Open Dataset of User Preferences for Text-to-Image Generation has the same loss function configuration as HPS-V2. However, there is a significant difference in the way the dataset for training the evaluation model is generated, and a method of expressing similar quality images as y=[0.5, 0.5] is added.
Summary and conclusion
Let's briefly summarize the content mentioned earlier.
In traditional vision models, performance evaluation was relatively easy because there were many tasks with clear predetermined answers. Performance evaluation was conducted using predetermined evaluation methods and datasets with assigned answers, allowing for easy comparison of models based on quantitative characteristics.
On the other hand, in image generative models, it is difficult to predetermine answers, making it challenging to design evaluation methods for quantitative evaluation. Therefore, various methods have been proposed to mimic human perception of image quality as closely as possible. These methods mainly evaluate quality based on visual quality or the alignment between the prompt used for generation and the result.
First, we examined methods for evaluating visual quality, divided into image processing-based methods and machine learning-based methods. We focused on commonly used methods like FID. Next, we looked at methods for evaluating prompt alignment, such as CLIP Score and recently introduced methods using QA. We also explored methods that simultaneously compare visual quality and alignment.
Recently, various research efforts have been actively conducted to achieve more precise and fair image evaluation, and new datasets and evaluation models are continuously being proposed. These advancements play a crucial role in objectively measuring and improving the performance of generative models.
Nowadays, we encounter various generated images in our daily lives. Some of these images surprise us with their quality, while others make us tilt our heads in confusion due to their oddness. Image evaluation methods not only allow for the evaluation of model performance based on uniform criteria but also help improve model performance. Additionally, they can serve as filters to prevent low-quality images from being provided to consumers in actual services.
In the next installment, we will explore how these evaluation methods are applied to improve the performance of various generative models. Stay tuned for more.


