Hello. We are Jongwoo Lee and Woonyeol Lee, and we develop data analytics platforms for LINE Ads.
Advertising revenue changes every day as products, advertisers, and campaign execution change. Advertising key performance indicator (KPI) dashboards quickly show the size of these changes, but they do not explain which items caused them or what to investigate next. Business teams had to compare metrics by product, industry, and advertiser and identify the causes themselves.
To reduce this repetitive work, we developed a system in which an artificial intelligence (AI) agent analyzes advertising performance data and automatically generates reports. The agent analyzes revenue data for LINE Official Account (OA) ads and display ads, calculates day-over-day, month-over-month, and year-over-year changes, and creates a report containing the main drivers and growth and churn signals. It then sends the report through Slack messages and email. Previously, team members had to access several systems, retrieve data, and identify causes themselves. With the system in place, they can now use the automatically generated daily report to immediately identify the main drivers and the areas that require investigation. This allows them to focus more on interpreting changes and deciding on follow-up actions than on collecting and organizing data.
The biggest question during development was how much work to assign to the large language model (LLM). This article explains how we separated calculation from interpretation when using an LLM, how we improved analysis quality, and how we designed an analytics agent to expand root-cause exploration.
Before we begin, the following abbreviations are used frequently throughout this article.
| Abbreviation | Meaning |
|---|---|
| OA | LINE Official Account ads |
| DA | Display ads |
| DoD | Day over day |
| MoM | Month over month |
| YoY | Year over year |
| MTD | Month to date |
What is the AI global advertising analytics report?
Before describing the technology in detail, let us first introduce the AI global advertising analytics report. The report consists of the following six sections and provides a structured explanation of the KPI analysis results for LINE OA ads and display ads.
| Section | Contents |
|---|---|
| Executive snapshot | The day's key changes and clearest causes for LINE OA ads and display ads |
| Key drivers (OA) | Causes of changes in LINE OA ads and their business implications |
| Key drivers (DA) | Causes of changes in display ads and their business implications |
| Trend diagnosis (OA) | Daily and monthly trend analysis for LINE OA ads |
| Trend diagnosis (DA) | Trend analysis for display ads by product type and campaign objective |
| Opportunity/risk signals | Growth and risk signals that require further observation, with suggested follow-up actions |
The following example illustrates the report format. The figures, industries, and advertisers below have been replaced with fictional values.
## Executive snapshot
- Month-to-date revenue for LINE OA ads was JPY 142.3M, up JPY 6.2M day over day. Renewals of plans by top accounts were concentrated at the beginning of the month, driving growth in usage-based products.
- Month-to-date revenue for display ads was JPY 88.5M, down JPY 4.1M day over day. The end of a large campaign in Industry A accounted for most of the decline.
...
## Key drivers (DA)
- Industry A led the decline in display ad revenue, falling JPY 3.6M day over day. The end of Advertiser B's campaign was the cause, while the remaining decrease reflected natural declines among many small advertisers.
- The financial services industry partially rebounded by JPY 1.2M, but its performance depends on spending by Agency C and requires continued monitoring.
Consistently generating a report in this format every day was not easy at first. Let us begin with the problems we encountered in our initial attempt.
Why a single prompt failed
In our first attempt, we put the day's aggregated data and business context into a single prompt and asked the model to generate the entire report at once. The output looked reasonable, but several problems prevented us from using it as an actual report.
- Numerical errors and missing aggregates: At first, we asked the LLM to perform the calculations. Explaining total revenue changes and contribution by cause, however, requires aggregating every item under consistent criteria and verifying that the sum of the details matches the overall change. The LLM could not perform this process reliably. Some items were omitted, and DoD, MoM, and YoY rates of change and rounding results varied from run to run.
- Missing important items: Even when we provided information about multiple products, industries, and advertisers in the prompt, the model sometimes selected and described only a subset. In a long context, it could omit even high-revenue contributors, and the generated output alone did not make those omissions immediately apparent.
- Unstable formatting: Guardrails such as section order, bullet count, and prohibited wording were not followed consistently. A single successful run was not enough because even low-probability formatting errors recur in a system that runs every day.
- Shallow interpretation: The model could summarize that total revenue had risen or fallen, but it could not connect the change to the products and advertisers that drove it. After reading the report, practitioners still had to open the source data and find the causes themselves.
This was more than a case of the model missing some information because of excessive input. The report needed not just numbers, but verified evidence showing how much each item contributed to the total aggregate. Reducing the amount of context alone could not solve this problem. Calculations, selection of important candidate items, and coverage checks had to be performed in code outside the generation process.
This experience became an important design principle for the system: We needed to separate what the LLM does well from work whose reliability must be guaranteed. We assigned the LLM to understand facts and generate natural sentences suited to the context, while code handled tasks requiring accuracy and completeness, such as aggregation and consistency checks.
Reliable reports: Separating calculation from interpretation
In the first stage, we clearly defined the scope assigned to the LLM. Instead of letting it recalculate figures or determine which items were important in the full dataset, code performed calculations and candidate selection, while the LLM turned verified facts into business-oriented prose. We followed these principles:
- DoD, MoM, and YoY changes and the items with the largest changes are calculated first during data analysis. The LLM does not recalculate confirmed figures; it interprets them from a business perspective.
- For each unit of analysis, such as product, industry, or advertiser, candidates are selected based on current revenue and the size of the change. We examine not only the top revenue items but also items with large changes, preventing the report from being built around only a few conspicuous figures.
- Each selected candidate is recorded with its current revenue, amount of change, and reason for selection, then passed to the relevant section. The LLM knows which items to prioritize, but it does not arbitrarily redefine the basis of the figures or their priority.
- The report is divided into sections that are generated in parallel. We use the OpenAI GPT-5.4 model with
reasoning effort = highfor section generation and call multiple sections concurrently withThreadPoolExecutor. If validation identifies a problem, only the failed section is regenerated.
The following simplified example shows how a report sentence is created.
Results calculated in code
- Display ad Industry A
    Current revenue JPY 5.68M, MoM -JPY 5.13M, YoY -JPY 1.61M

Code-based candidate selection
- Detected as an item with a large absolute MoM change by industry
- Classified as a high-impact item and assigned priority in [Key drivers: Display ads]

Facts added to the section prompt
- [HIGH IMPACT] [Key drivers: Display ads] [Display ad industry] Industry A (current JPY 5.68M, MoM -JPY 5.13M, YoY -JPY 1.61M, selection reason: large_mom_diff)

Example LLM output
- Month-to-date revenue for Industry A was JPY 5.68M, down JPY 5.13M from the same period of the previous month.
The values JPY 5.68M and -JPY 5.13M in this example were not calculated by the LLM from the raw data. The data analysis stage calculated them for the appropriate comparison date, and the candidate selection stage confirmed them together with their impact. Based on these verified figures, the LLM expresses the meaning and priority of the change and the required follow-up checks in natural language. This approach reduced numerical errors, missing important items, and formatting inconsistencies, making daily report operation possible.
Automating analysis with an analytics agent
The report from the previous stage could explain which metrics changed and by how much. Aggregated data alone, however, could not fully explain why those changes occurred. For example, even if revenue from a particular product group increased substantially, the actual cause could be growth in a certain industry or a large campaign by a single advertiser. When data analysts discover such a change, they progressively narrow the scope by examining several dimensions, including product, industry, and advertiser. When necessary, they also compare historical trends or similar groups.
Initially, we implemented this analytical process as a fixed directed acyclic graph (DAG). We predefined which metrics to examine and in what order, then ran the same analytical path every day. In actual root-cause analysis, however, the next target depended on that day's data. Even when revenue increased for the same product, on one day a particular industry might explain most of the increase, while on another day a single advertiser might drive it. Defining every possible analytical path as a condition would quickly make the DAG complex, and every new pattern would require another analysis flow.
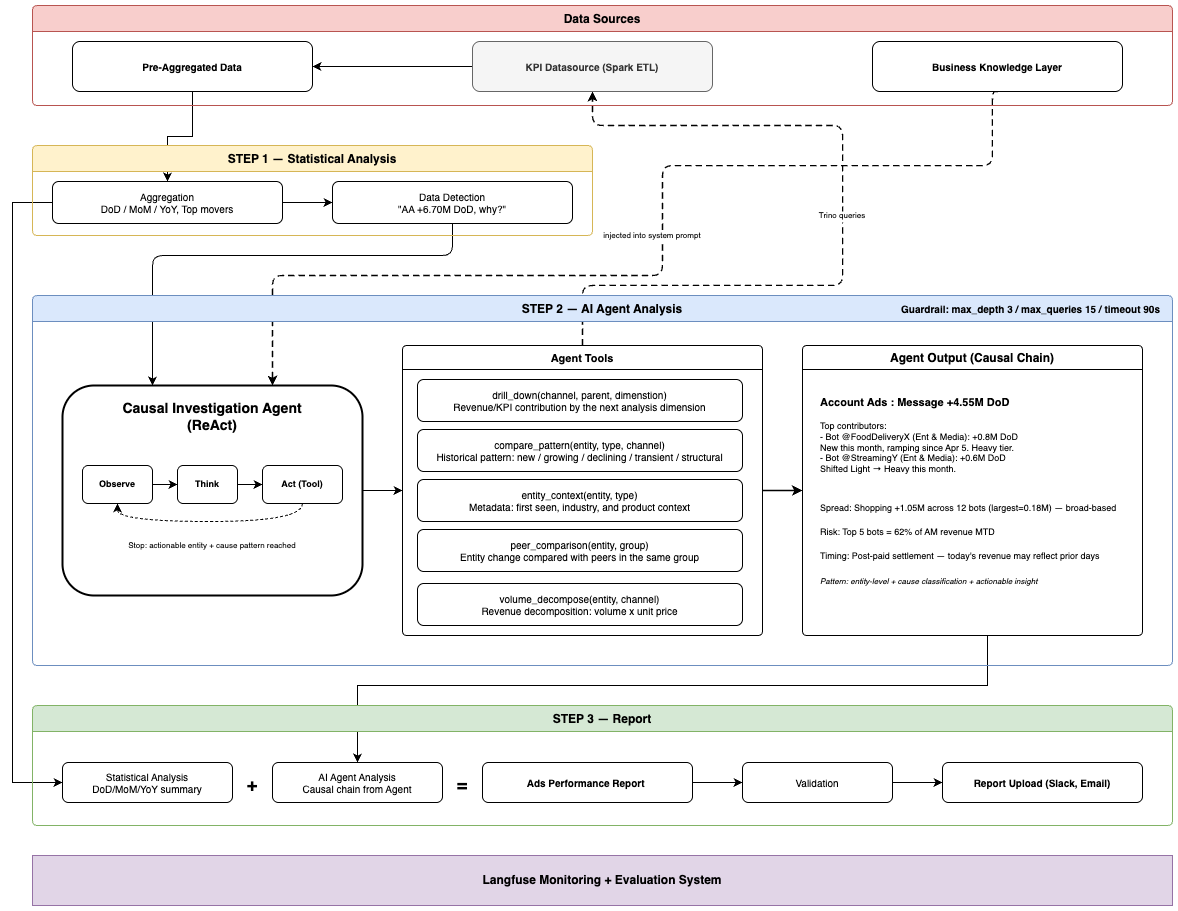
We therefore introduced a Reasoning and Acting (ReAct) agent structure. It starts with pre-aggregated KPI data and, when that information is insufficient to explain a cause, selects the required analytical dimension and query range and executes a Trino query. By examining an observation and deciding its next action, the ReAct structure chooses what to investigate next without a fixed path. As a result, we do not need to predefine every possible execution path in a DAG. Instead, we restrict the dimensions and transitions available to the agent with a graph.
The following architecture connects pre-aggregated KPI data, additional agent exploration, and section-level report generation.
Designing the agent's data access and exploration scope
We did not configure the agent to query every analysis directly. Running a Trino query whenever a top-level KPI is checked repeats the same aggregation and can lengthen total report generation time depending on cluster conditions. Conversely, using only data precomputed in Spark makes it difficult to explore beyond predefined analytical dimensions.
We therefore assigned distinct roles to two data access methods.
- Pre-aggregated KPI data: Quickly identifies changes by product and industry and selects the main items that changed.
- Trino query results: Retrieves additional information needed for root-cause exploration, such as advertiser history, trends by period, and comparisons with similar groups.
The agent first examines the pre-aggregated KPIs. If it determines that the current data is insufficient to explain the change, it selects the target, analytical dimension, and period, then retrieves additional data from Trino. It determines the next analytical path from those results.
We did not allow the agent to explore every database table and column freely. Excessive freedom could lead it to join identifiers with different meanings or repeatedly query dimensions irrelevant to the analysis. Instead, we defined the relationships among valid business dimensions as an "exploration graph".
For example, the available exploration paths are as follows.
- LINE OA ads: Total revenue → product group → detailed product, industry, and agency → account and advertiser
- Display ads: Total revenue → ad sales type → industry, campaign attribute, and channel → advertiser and product
Each node defines the data source to use and the analytical units that can be examined next. The agent chooses a path based on the data, but the system limits what it can inspect. This structure reduces repetitive top-level aggregation while allowing expansion into the detailed analysis that is needed. It also reduces the risk of connecting incorrect dimensions or exploring unnecessary data.
Implementing the analysis loop with tool calling
We implemented the analysis workflow using tool calling in the OpenAI Python software development kit (SDK). Here, a tool is an analysis function that the agent can call. When the model selects a tool and its input values, the backend executes the function and sends the result back to the model.
We used the following five tool functions for analysis.
| Tool | Role |
|---|---|
drill_down | Breaks revenue into finer analytical units and returns the main contributors |
compare_pattern | Classifies trends by period as new, growing, declining, or structural patterns |
entity_context | Retrieves metadata for the analysis target, such as its first revenue date and industry |
peer_comparison | Compares the analysis target with the average for its group |
volume_decompose | Decomposes revenue changes into unit price and volume factors |
The execution process is straightforward. Based on the analysis results so far, the model selects the next tool and its input values. The backend executes the function and sends the result back to the model. This process repeats until sufficient evidence has been collected.
messages = [
        {"role": "system", "content": system_prompt},
        {"role": "user", "content": user_content},
]
seen_calls = set()

for _ in range(MAX_QUERIES):          # Repeat up to the maximum number of analysis loops allowed for each driver
        resp = client.chat.completions.create(
                model=OPENAI_MODEL,
                messages=messages,
                tools=TOOL_SCHEMAS,           # name/description/schema for the five analysis functions
                tool_choice="auto",
        )
        msg = resp.choices[0].message

        # If there is no tool call, the model returns the final analysis path
        if not msg.tool_calls:
                return parse_causal_chain(msg.content)

        messages.append(msg)
        for tc in msg.tool_calls:
                name = tc.function.name
                args = json.loads(tc.function.arguments)

                # Block duplicate execution of the same tool and parameter combination
                key = f"{name}:{json.dumps(args, sort_keys=True)}"
                if key in seen_calls:
                        result = {"status": "duplicate_call"}
                else:
                        seen_calls.add(key)
                        result = TOOL_DISPATCH[name](**args)   # Execute the actual Python analysis function

                # Add the result as a tool message and call the model again in the next iteration
                messages.append({
                        "role": "tool",
                        "tool_call_id": tc.id,
                        "content": json.dumps(result, ensure_ascii=False),
                })
We also applied guardrails to the agent's autonomous exploration. We prevented repeated calls with the same tool and parameter combination and limited the maximum number of analysis steps for each driver and the total execution time. The entire analysis does not stop immediately when a Trino query fails or returns no data.
Each tool returns one of the following statuses.
ok: The analysis result was returned successfullyno_data: No data matched the conditionserror: An error occurred during retrieval or analysis
The model receives this status with the result. For example, if a query for a particular dimension returns no_data, the model can select a different dimension instead of continuing to explore in the same direction. In this way, the model decides the next analytical action, while code controls the number of repetitions, the queryable scope, and the actual data processing.
Examining an actual analysis path
We did not make the analysis path a single fixed sequence. Even for the same increase in LINE OA ad revenue, the analysis might need to move from product to industry in one case and inspect an agency or advertiser in another.
For example, when investigating an increase in revenue for a particular LINE OA ad product group, the agent can proceed as follows.
- Use
drill_downto break down the product group by detailed product. - If usage-based products explain most of the change, break them down again by industry.
- If a particular industry makes a large contribution, analyze the impact by advertiser.
- Use
compare_patternto determine whether the change is a new inflow, sustained growth, or a temporary fluctuation. - Return the contribution and limitations at each stage as a structured analysis path.
On another day, the first product breakdown might provide a sufficient explanation, or checking agencies before industries might be more appropriate. At each stage, the model uses the previous tool result to select the next tool and its input values. The system prompt limits the scope of its decisions by supplying product knowledge, explorable dimensions, termination conditions, and the result schema, while the actual exploration order is determined from the data.
Validating the agent's analysis results
Even when the agent finds a large change, we cannot immediately treat that item as a cause. For example, if total revenue increased but an item found in the detailed analysis decreased, their directions do not match. Even if a particular advertiser changed substantially, we should not expand it into the cause of the total revenue change when it explains only a small portion. In addition, when data sources use different revenue recognition times or billing standards, a change on the same date is not enough to claim a direct causal relationship.
We therefore do not use the agent's analysis result directly as a cause. Before including it in the report, we apply evidence grading. Rule-based logic compares the direction and contribution of the change at each analytical stage with those of the parent stage. Predefined business rules and data constraints are then applied to classify the evidence into three statuses.
driver_eligible: The direction and contribution relationship match, so the evidence can be used to explain a main drivercaution_only: Some movement is visible, but a mismatch or data constraint means the evidence can be used only as a cautionmonitoring_signal: A change was observed, but there is insufficient evidence to identify it as a main driver
Suppose, for example, that we obtain the following result.
{
    "trigger": "LINE OA ad product group +5.44M DoD",
    "causal_chain": [
        {
            "level": 1,
            "entity": "Usage-based product",
            "contribution": "+4.65M"
        },
        {
            "level": 2,
            "entity": "Shopping",
            "contribution": "+1.82M",
            "pattern": "structural",
            "reconciliation_status": "driver_eligible"
        },
        {
            "level": 3,
            "entity": "Advertiser A",
            "contribution": "+0.95M",
            "pattern": "new_entity",
            "reconciliation_status": "driver_eligible"
        }
    ],
    "risk": "Actual usage and settlement timing may differ."
}
If the direction and contribution remain consistent through the advertiser level, we can classify the result as driver_eligible and use it as causal evidence. Conversely, if the detailed items sum in the opposite direction from the overall change or explain too little of it, we exclude the result as a cause and classify it as a monitoring_signal. This process separates the agent's exploration results from the causes that the report can actually claim.
Providing only the context each section needs
Even evidence that passed validation was not provided uniformly to every report section. Initially, we supplied every section with the same analytical context. As the context grew longer, however, important information became buried and the same figures were repeated across sections. Signals that had not yet been confirmed also sometimes appeared as main causes in the executive snapshot. We therefore divided the analysis results into three types of context based on their purpose.
- Causal context: Evidence used to determine whether something can be treated as a cause and to explain why a change occurred
- Statistical analysis: Evidence used to verify figures, rankings, and revenue trends
- Business knowledge: Billing methods and considerations when interpreting the data
Each report section receives only the context required for its purpose.
The executive snapshot receives only validated main causes. Trend diagnosis focuses on trends over time and statistical information rather than causal judgments. Opportunity/risk signals receive both confirmed causes and context requiring further investigation, together with conditions and follow-up actions.
The following example shows how a single fictional event, the end of a large campaign in Industry A, is reflected in each section.
| Section | Context strategy | Example report text |
|---|---|---|
| Executive snapshot | Overall revenue change + top driver_eligible causes (excluding caution_only, monitoring_signal, and internal validation information) | DA MTD revenue was JPY 88.5M, down JPY 4.1M day over day, with the end of a large campaign in Industry A explaining most of the decline. |
| Key drivers | driver_eligible causes + statistical analysis to confirm scale and contribution (caution_only appears only as a caution) | Industry A led the DA decline with a day-over-day decrease of JPY 3.6M, and the confirmed cause was the end of Advertiser B's campaign. |
| Trend diagnosis | Daily, monthly, and yearly trends + rankings by product (no causal context provided) | Industry A's MTD revenue is down 8% MoM, continuing the recent slowdown. The number of campaigns with large budget spending is decreasing. |
| Opportunity/risk | Changes confirmed as driver_eligible + caution_only and monitoring_signal, separated into signals, conditions, and follow-up actions | Risk: The end of Advertiser B's campaign may leave a gap in display ad spending next week, so follow-up spending plans should be confirmed. |
The same decline in Industry A appears as a one-line cause in the executive snapshot, as a scale and confirmed cause in key drivers, as a trend without causal judgment in trend diagnosis, and as a signal requiring follow-up action in opportunity/risk signals.
After separating the context by section, we also needed criteria for repeatedly assessing and improving report quality in production.
Evaluation system: Designing repeatable quality standards
Bringing the report to a production-ready level required reviews from many people. Within the team, we checked whether the figures and evidence were correct and whether the analytical logic went too far. Business teams and the sales organization checked whether the report prioritized important changes and whether its explanations supported actual decisions and follow-up actions.
This feedback did more than correct individual sentences. We organized recurring comments into evaluation items and decision criteria, then applied the same standards to every subsequent report. We consolidated the accumulated review feedback into an evaluation rubric and used it as our quality-control standard.
Turning review feedback into evaluation items
We divided the evaluation system into quantitative items that can be assessed automatically and qualitative items that require human judgment.
| Evaluation method | Items checked | Decision method |
|---|---|---|
| Quantitative evaluation | Currency notation, section structure, bullet count, sentence length, and exposure of internal terminology | Rule-based classification as normal, missing, or requiring review |
| Qualitative evaluation | Domain accuracy, analytical priorities, validity of causal explanations, appropriateness of monitoring items, and business usefulness | Classification as pass, needs-review, or fail using the same rubric |
Quantitative evaluation is a safeguard that confirms whether a report meets the minimum operational requirements. Qualitative evaluation, by contrast, assesses whether the report provides the priorities and sufficient evidence needed for real decisions. Even when currency notation and section structure are correct, a report is not useful if it fails to explain important changes or asserts causes without evidence. We defined these qualitative evaluation items from questions and feedback raised repeatedly in internal team reviews and reviews by business and sales teams.
During actual reviews, we repeatedly asked questions such as the following.
Examples:
- If daily revenue increased but the MTD MoM and YoY trends remain weak, does the report explain both facts?
- If an identified advertiser or official account explains only part of the overall change, does the report avoid presenting it as the sole cause?
- Does the report treat billing methods and revenue recognition timing as interpretive cautions rather than confirmed causes?
- Does each opportunity include the analysis target, numerical evidence, and the next item to investigate?
We applied the same evaluation rubric to both manual human evaluation and automated LLM-as-a-judge evaluation. Automated evaluation alone did not determine final quality, however. Reports requiring business judgment were sent to a human annotation queue, where a person could review the execution trace and make the final decision.
Connecting the entire run in a Langfuse trace
The agent's final output alone does not reveal whether a problem originated in the data, a tool call, or the prompt. We therefore linked not only the generated output but also intermediate calculations, agent exploration, section generation, and evaluation results into a single execution unit in a Langfuse trace. This lets us track the following stages.
- Full report generation
- Data loading and KPI aggregation and analysis
- Agent
iterationandtool callby analysis target - LLM output by section
- Quality score and final decision
Each trace records the report date, code version, model, reasoning effort, and report mode. This allows us to identify the failed stage and compare results produced by different prompt or agent versions under the same conditions.
With this structure, we do not need to modify the prompt based only on the final output when a report problem is found. If an important item is missing, for example, we can check in order whether it was selected as a candidate during data analysis, included in the prompt during context construction, and omitted during LLM generation. Identifying the stage where the problem occurred also tells us whether to improve the data analysis rules, context construction, or prompt.
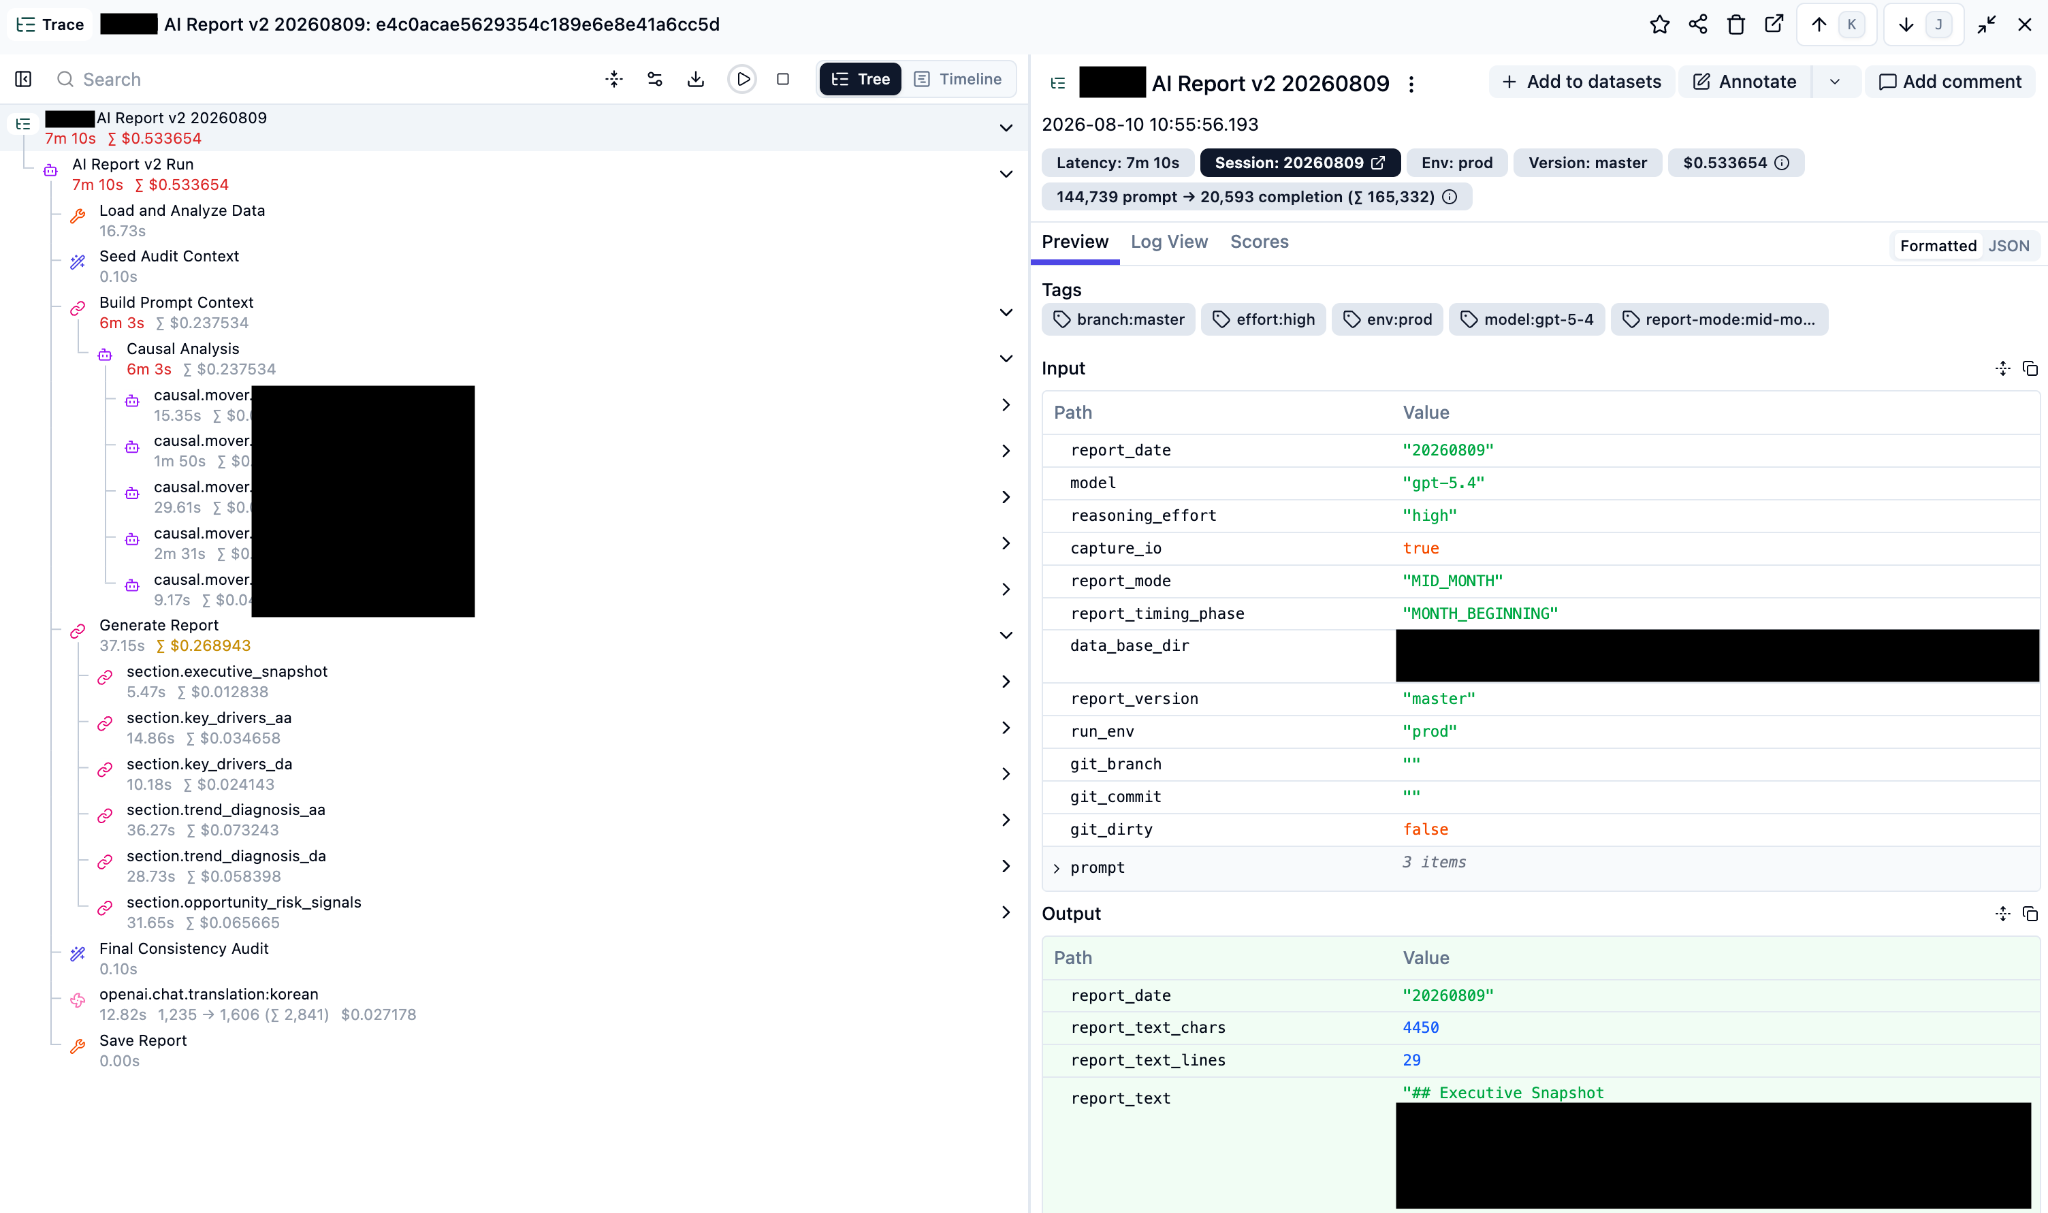
At generation time, we save the report and its trace. Evaluation is separated into a process that rescores the stored result against the same criteria. The two results are linked by the trace version information. This allows us to compare quantitative scores and qualitative evaluations before and after changing a prompt or agent policy without relying on subjective impressions. Problems found during review are added to the rubric, and the next version is measured again against the same criteria, creating an evaluation loop.
Conclusion
At first, we thought a well-designed prompt would be enough to produce a reliable report. In production, deciding where to assign responsibility for calculation, exploration, interpretation, and validation mattered more than the prompt itself. We can summarize what we learned while building an analytics system with an AI agent in four lessons.
- The responsibilities of the LLM and code must be clearly separated
Code should handle work requiring accuracy and reproducibility, such as calculations, aggregation, and consistency validation, while the LLM focuses on interpretation and writing. - The agent's autonomy must be calibrated
Properly limiting the scope and paths of exploration reduces unnecessary queries and incorrect reasoning while retaining the required flexibility. We defined traversable dimensions in an exploration graph and added guardrails such as duplicate-call blocking and a cap on investigation steps. - The scope of context determines output quality
Providing only information relevant to the purpose reduces overinterpretation and uses tokens efficiently. Separating context by section, such as including only confirmed causes in summaries and only statistical trends in trend sections, reduced context contamination and improved output quality. - Quality must be measurable before improvements can be validated
Execution results and processes must be recorded and compared under the same evaluation criteria to determine whether a prompt or policy change led to a real improvement. We recorded every run in a versioned trace and scored before-and-after results under the same conditions with a human-defined rubric. This allowed us to trace the stage where a problem occurred and confirm whether a change actually improved quality.
We hope this article is useful to anyone developing data analysis automation or an LLM-based reporting system. Thank you for reading.