Hello. My name is Gi Jun Oh, and I am responsible for the development and operation of the in-house time series database (TSDB) in the Observability Infrastructure team at LY Corporation.
LY Corporation’s private cloud platform goes far beyond simply providing virtual machines. It offers a vast service portfolio, including a Kubernetes-based container environment, databases, and load balancers. Given infrastructure at this scale and the tens of thousands of applications running on top of it, how can we effectively understand and manage their state?
If you only have around 10 or 100 servers, it might be feasible for engineers to log into each server and check its status manually. However, once the number of servers exceeds tens of thousands and service architectures become deeply intertwined, this quickly surpasses the limits of human cognition.
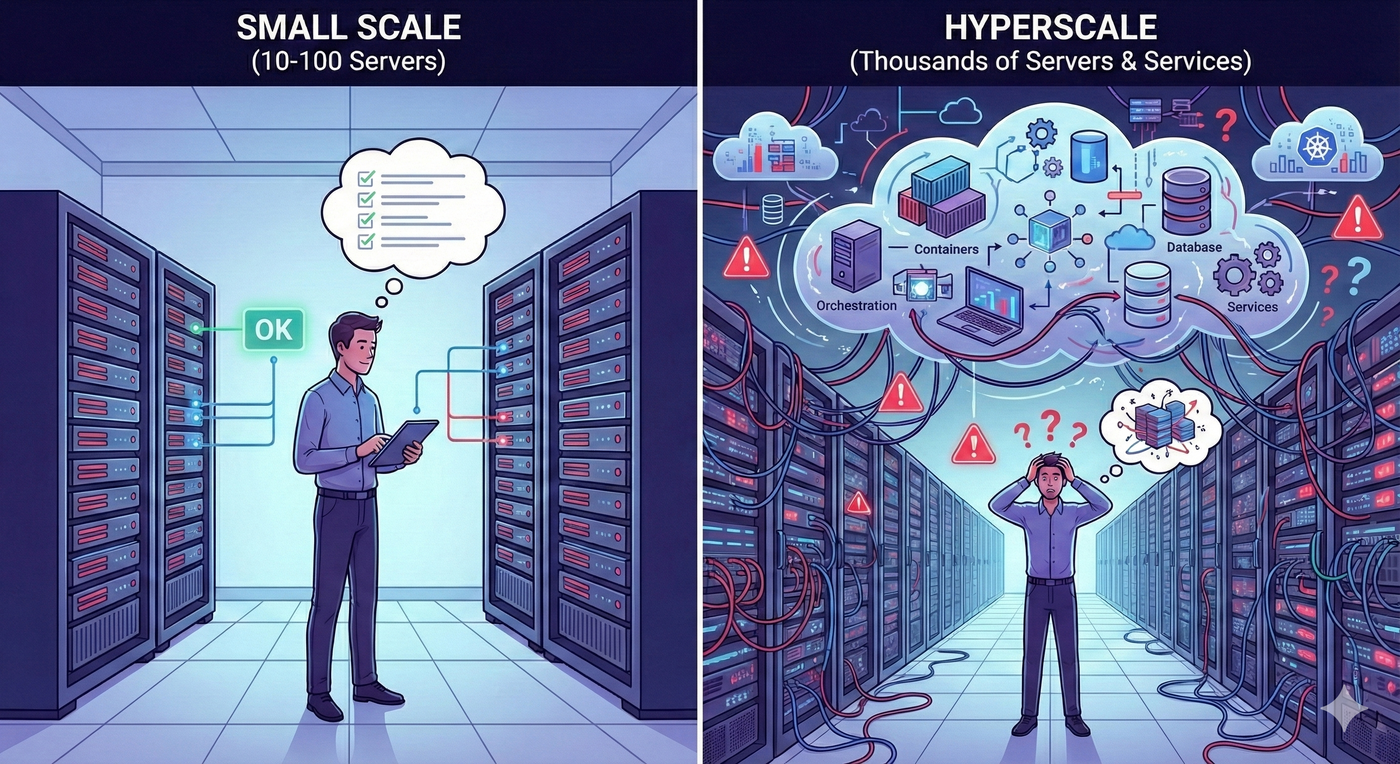
This is exactly where our team steps in, by providing an observability platform. Our core mission is to allow developers to focus on business logic without worrying about infrastructure state, while enabling operators to manage systems stably based on data.
So what exactly is observability? Originally derived from control theory, the term refers to “how well one can infer the internal state of a system solely from its external outputs”. When applied to software engineering, it means the ability to determine whether a service is healthy and where bottlenecks might exist by examining the various data emitted by the system.
Of course, storing every single system output is physically impossible. As a result, modern observability systems define and collect three key pillars of data for understanding system state: metrics, logs, and traces. In this article, we will look back on our technical journey toward efficiently storing and processing metrics, and share our future strategy for evolving into an “intelligent platform” by integrating data and artificial intelligence (AI).
The impact of metric storage on observability
In the field of information technology (IT) system monitoring, a metric refers to “time-series data that assigns a timestamp to a numerical value representing the system state at a specific point in time”. Users visualize this time-series data to monitor service trends and receive alerts when values exceed predefined thresholds. More recently, the field has evolved beyond simple reactive approaches such as “send an alert when CPU usage exceeds 90%”. By introducing time-series forecasting algorithms such as AutoRegressive Integrated Moving Average (ARIMA) and Prophet, systems are now able to proactively detect signs of failure in advance.
When a service is small, managing time-series data is not particularly difficult. However, as services grow and infrastructure becomes more sophisticated, data volume increases exponentially. To get a sense of this scale, let us consider a hypothetical time-series data structure where each tag key and value is limited to 64 bytes.
struct tag {
char key[64]; // 64 bytes
char value[64]; // 64 bytes
};
struct timeseries {
uint64_t timestamp; // 8 bytes
struct tag *tags; // 8 bytes in 64 bits system
uint64_t value; // 8 bytes
};Assume that a single metric measuring server CPU usage is generated every 15 seconds. Including tag information such as host name and type, the size of one data point can be estimated as follows.
struct timeseries ts = {
  .timestamp = 1625079600,                 // 8 bytes
  .tags = (struct tag[]) {                 // 8 bytes (for pointer)
    [0] = {.key="host", .value="server1"}, // 128 bytes (64 bytes + 64 bytes)
    [1] = {.key="type", .value="cpu"},     // 128 bytes
  },
  .value = 42                              // 8 bytes
};
This results in roughly 280 bytes per metric. You might think, “Only 280 bytes?”. However, the story changes when you scale this across time and infrastructure size. Storing only the CPU metric for a single server requires about 562 MiB per year. If the number of servers grows to 1,000, that becomes 548 GiB, and once you add basic metrics such as memory, disk, and network, annual storage requirements quickly balloon into the tebibyte (TiB) range.
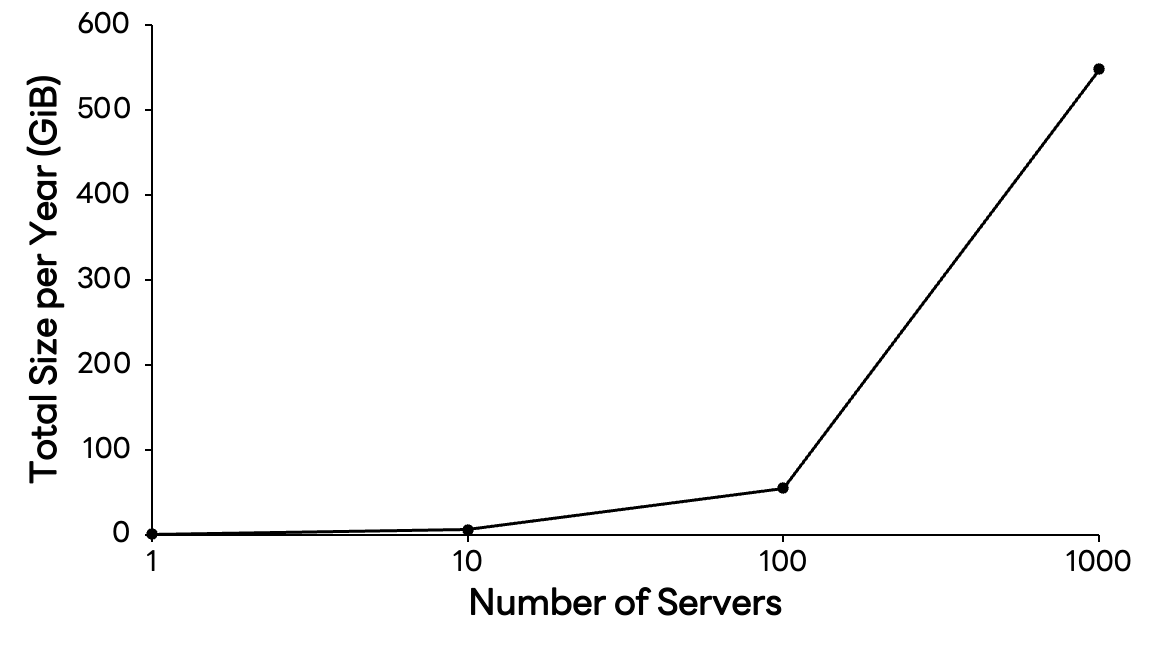
In cloud-native environments, monitoring targets (cardinality) grow exponentially. Amid this massive wave of data, the ability to store data cost-effectively and query it with minimal latency is directly tied to service stability. Solving this challenge is difficult with general-purpose databases alone. A specialized time-series engine, in other words a time series database, is essential, and our team develops and operates one in-house.
Today, our time series database processes metrics at a scale of trillions of records per day. So how did we develop our own engine, and how were we able to build a system capable of sustaining such enormous traffic?

The journey to building our own time series database: challenges and breakthroughs
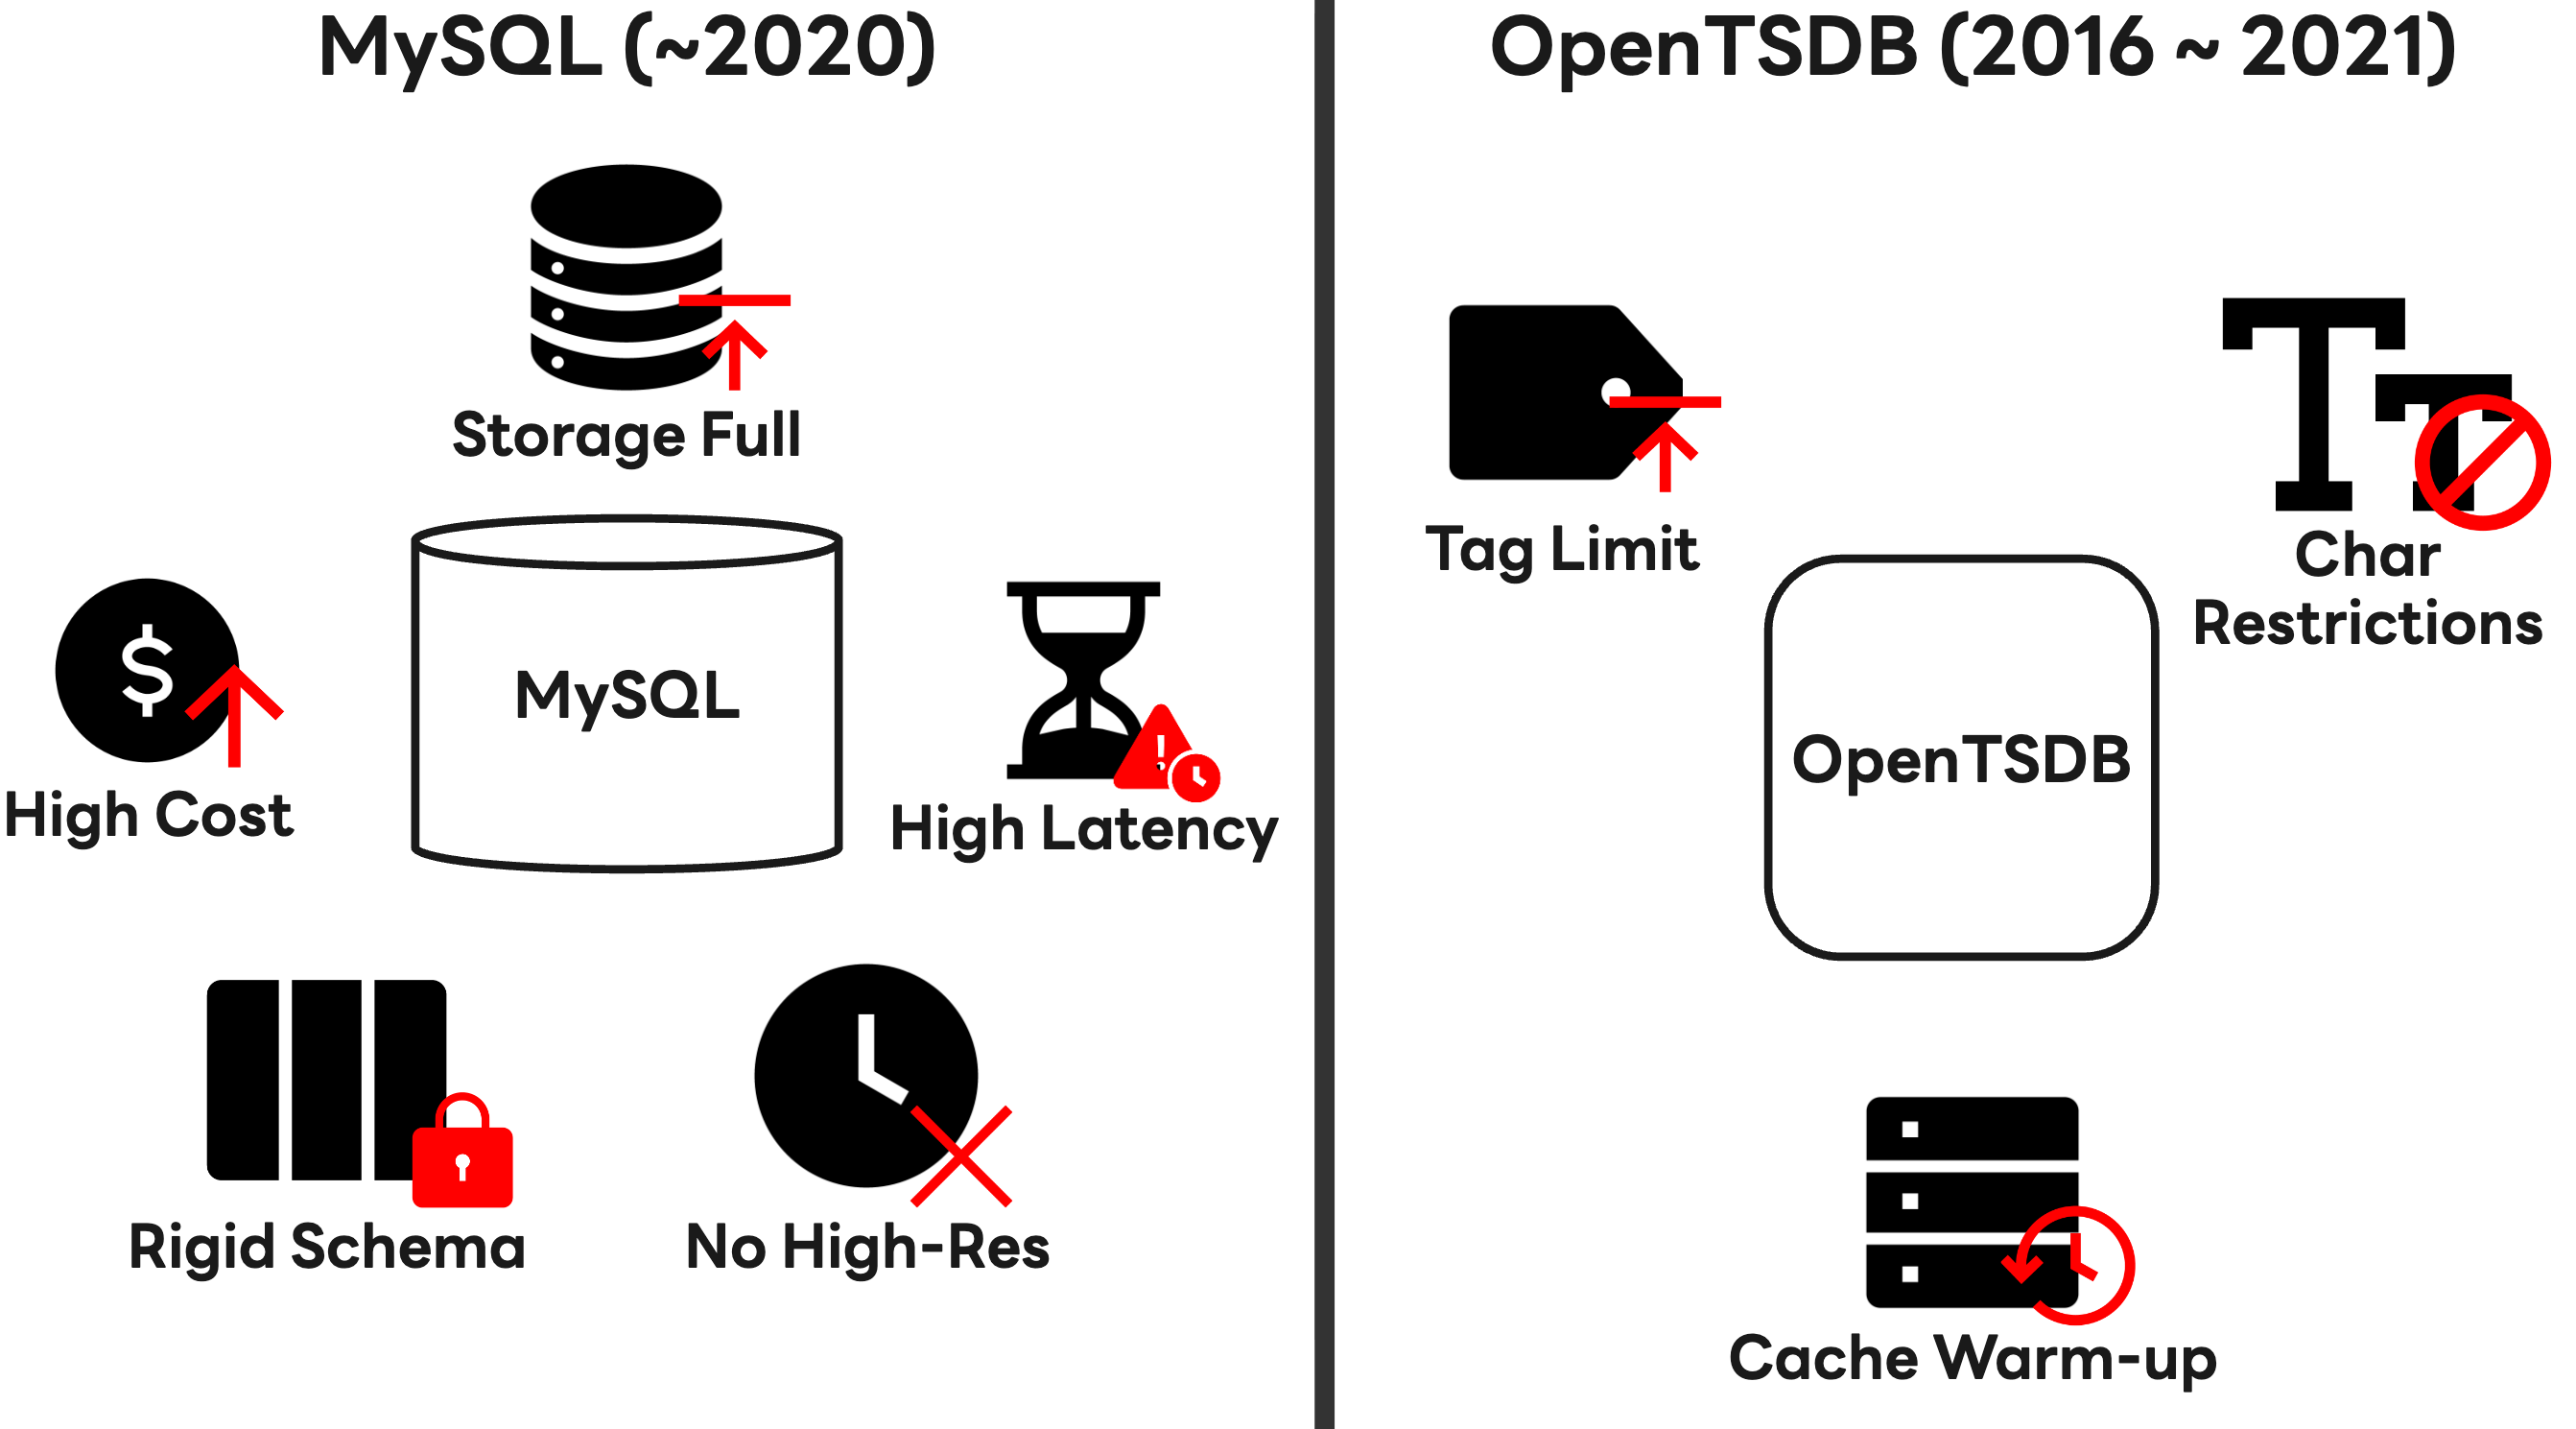
In the early days, our team stored time-series data using MySQL, a relational database. However, as our architecture transitioned from service oriented architecture (SOA) to microservice architecture (MSA), service components were broken down into much smaller units. As a result, the amount of data to be monitored increased rapidly, and we faced a triple challenge: soaring operating costs, insufficient storage capacity, and increasing query latency.
While measures such as MySQL sharding helped us address immediate issues, they were not a fundamental solution. Due to the inherent characteristics of relational databases, the heavy write load and degraded read performance with massive datasets made it practically impossible to collect high-resolution metrics at intervals shorter than one minute. In addition, the rigid tag schema structure was ill-suited to capturing rapidly changing resource information in cloud environments.
As a result, in 2016 we introduced OpenTSDB, an open-source time series database built on Apache HBase. Early on, it offered significantly better write performance compared to MySQL and gave us hope. However, as operational time increased, we encountered limitations for the following reasons.
- Limited tag usage: As the number of tags increased, the performance of UID table lookups degraded, forcing us to impose practical limits on tag counts. This made it difficult to fully represent the complexity of modern cloud resources.
- Character restrictions: Only
a-z, A-Z, 0-9, -, _, ., /were allowed, making it unsuitable for storing metadata from global services that use diverse languages and formats. - Query inefficiency: To ensure acceptable performance for large-scale queries, a “warm up” process that preloaded data into cache was required, increasing operational complexity.
“Is it possible to respond immediately to rapidly changing business requirements without degrading user experience (UX)?”
Existing solutions could not answer this question, and ultimately we made the bold decision to develop our own engine. When we began in-house time series database development in 2018, our goals were clear.
- Flexibility: Support for diverse protocols without being tied to a specific agent
- Scalability: A non-disruptive architecture that maintains linear performance even during traffic spikes
- Performance: Processing high-resolution metrics at intervals shorter than one minute without latency, maximizing data visibility
- Availability: Robustness that does not degrade user experience under any failure scenario
After about a year of development, in 2019 we completed our own time series database that absorbed the strengths of open source while addressing its weaknesses.
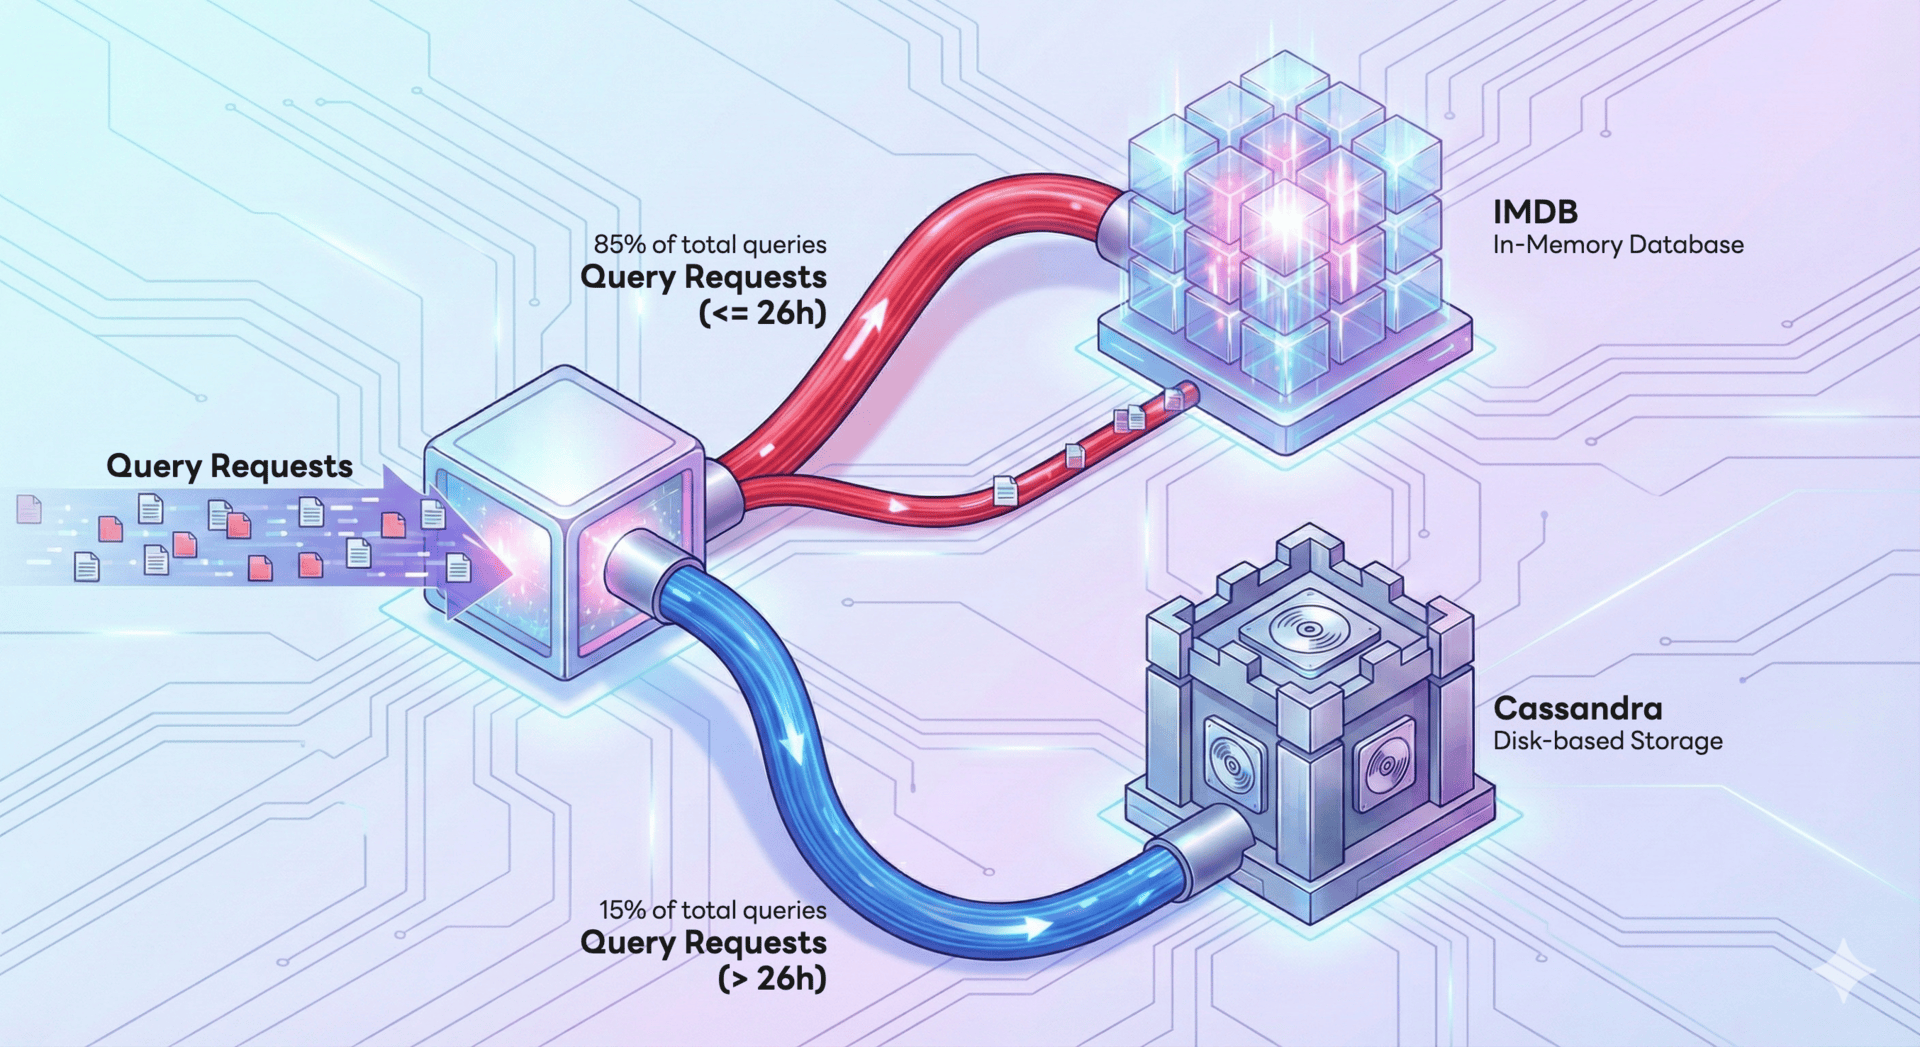
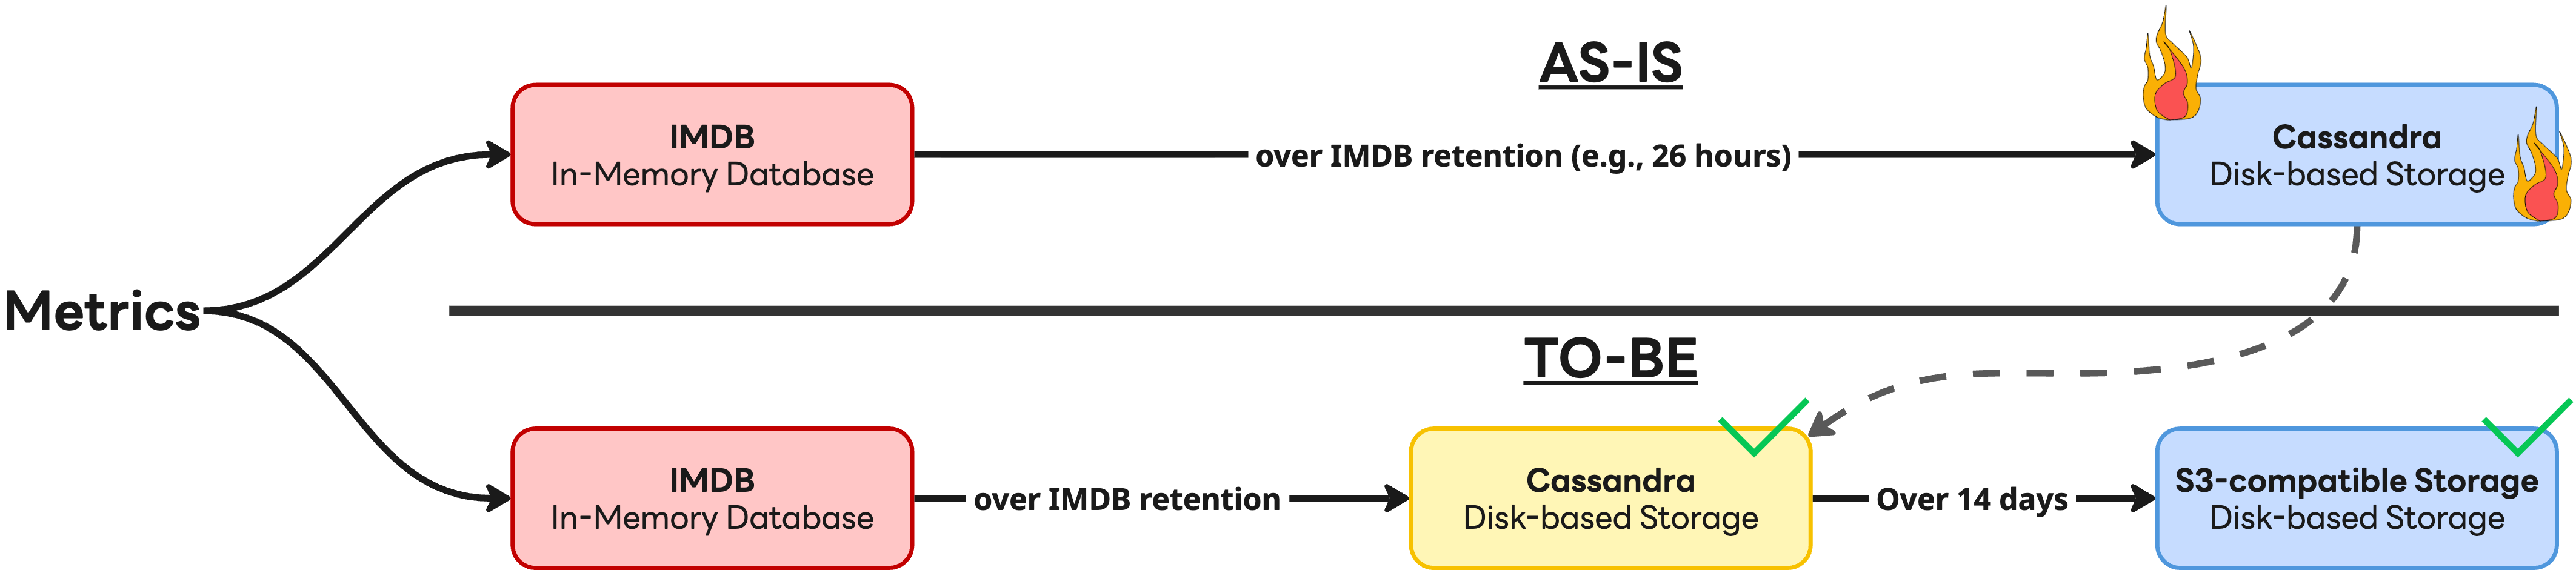
The most significant technical achievement during development was architecture optimization based on data access patterns. We were inspired by a paper published by Meta titled “Gorilla: A fast, scalable, in-memory time series database”, which noted that 85% of data queries focus on the most recent 26 hours. Based on this insight, we devised a multi-tier storage strategy that balanced performance and cost. Frequently accessed metrics are handled by an in-memory database (IMDB) to minimize latency, while less frequently accessed data is stored in the disk-based Apache Cassandra (hereafter Cassandra) to optimize storage costs. The diagram below illustrates this structure.
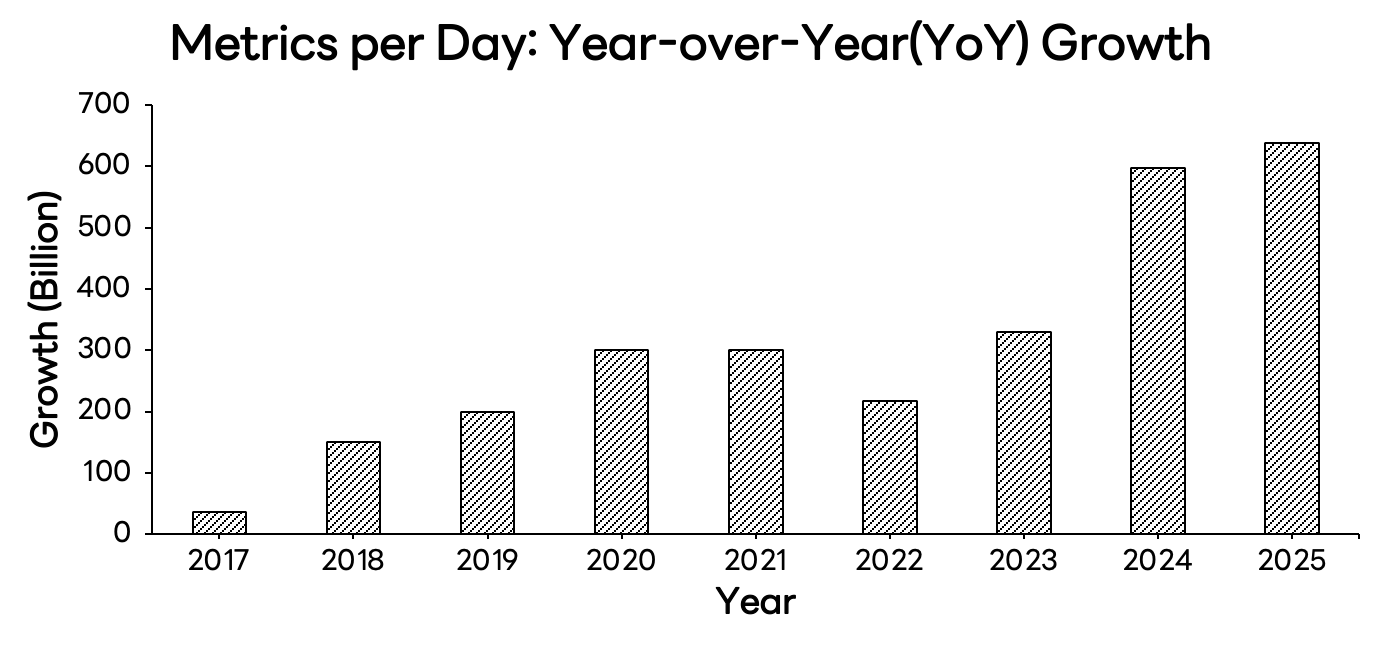
Introducing our own solution acted as a catalyst for unlocking previously constrained feature requirements. Since 2019, it has enabled annual growth where daily metric ingestion (metrics/day) has increased by more than 200 billion records year over year.
Above all, we want to emphasize that this sweeping transformation, from MySQL to OpenTSDB and ultimately to our own engine, was delivered to users in a seamless manner. While fundamentally reinventing the backend architecture, we maintained full compatibility with existing application programming interfaces (API). As a result, users were able to enjoy performance improvements naturally, without needing to migrate or modify their code.
A dam for surging time-series data
The joy of in-house development was short-lived. After the release of our own time series database, the internal infrastructure environment underwent yet another major transformation, as most services were migrated in large numbers to Kubernetes.
In virtual machine environments, servers typically had long life cycles. In Kubernetes environments, however, pods are created and destroyed frequently, resulting in high churn. With volumes also being dynamically allocated, the volume and complexity of metrics that the observability platform had to handle skyrocketed beyond imagination. Users demanded more metrics and longer data retention periods, which rapidly exhausted storage resources.
Both storage systems, IMDB and Cassandra, hit their scalability limits. IMDB clusters could only be expanded with nodes of identical specifications, making node procurement difficult. Cassandra clusters, burdened by massive datasets, required tens of hours for rebalancing, preventing agile scaling. It was like facing a flood while dam reinforcement work was delayed, leaving us helpless.
So how could we overcome this crisis? The answer was to build a flexible and robust structure that could withstand floods. Rather than simply reinforcing the dam, we implemented the following fundamental architectural improvements.
- IMDB optimization: We replaced the existing load-balancing algorithm with a weighted load-balancing algorithm that accounts for differences in processing capacity between nodes, allowing loads to be distributed more appropriately.
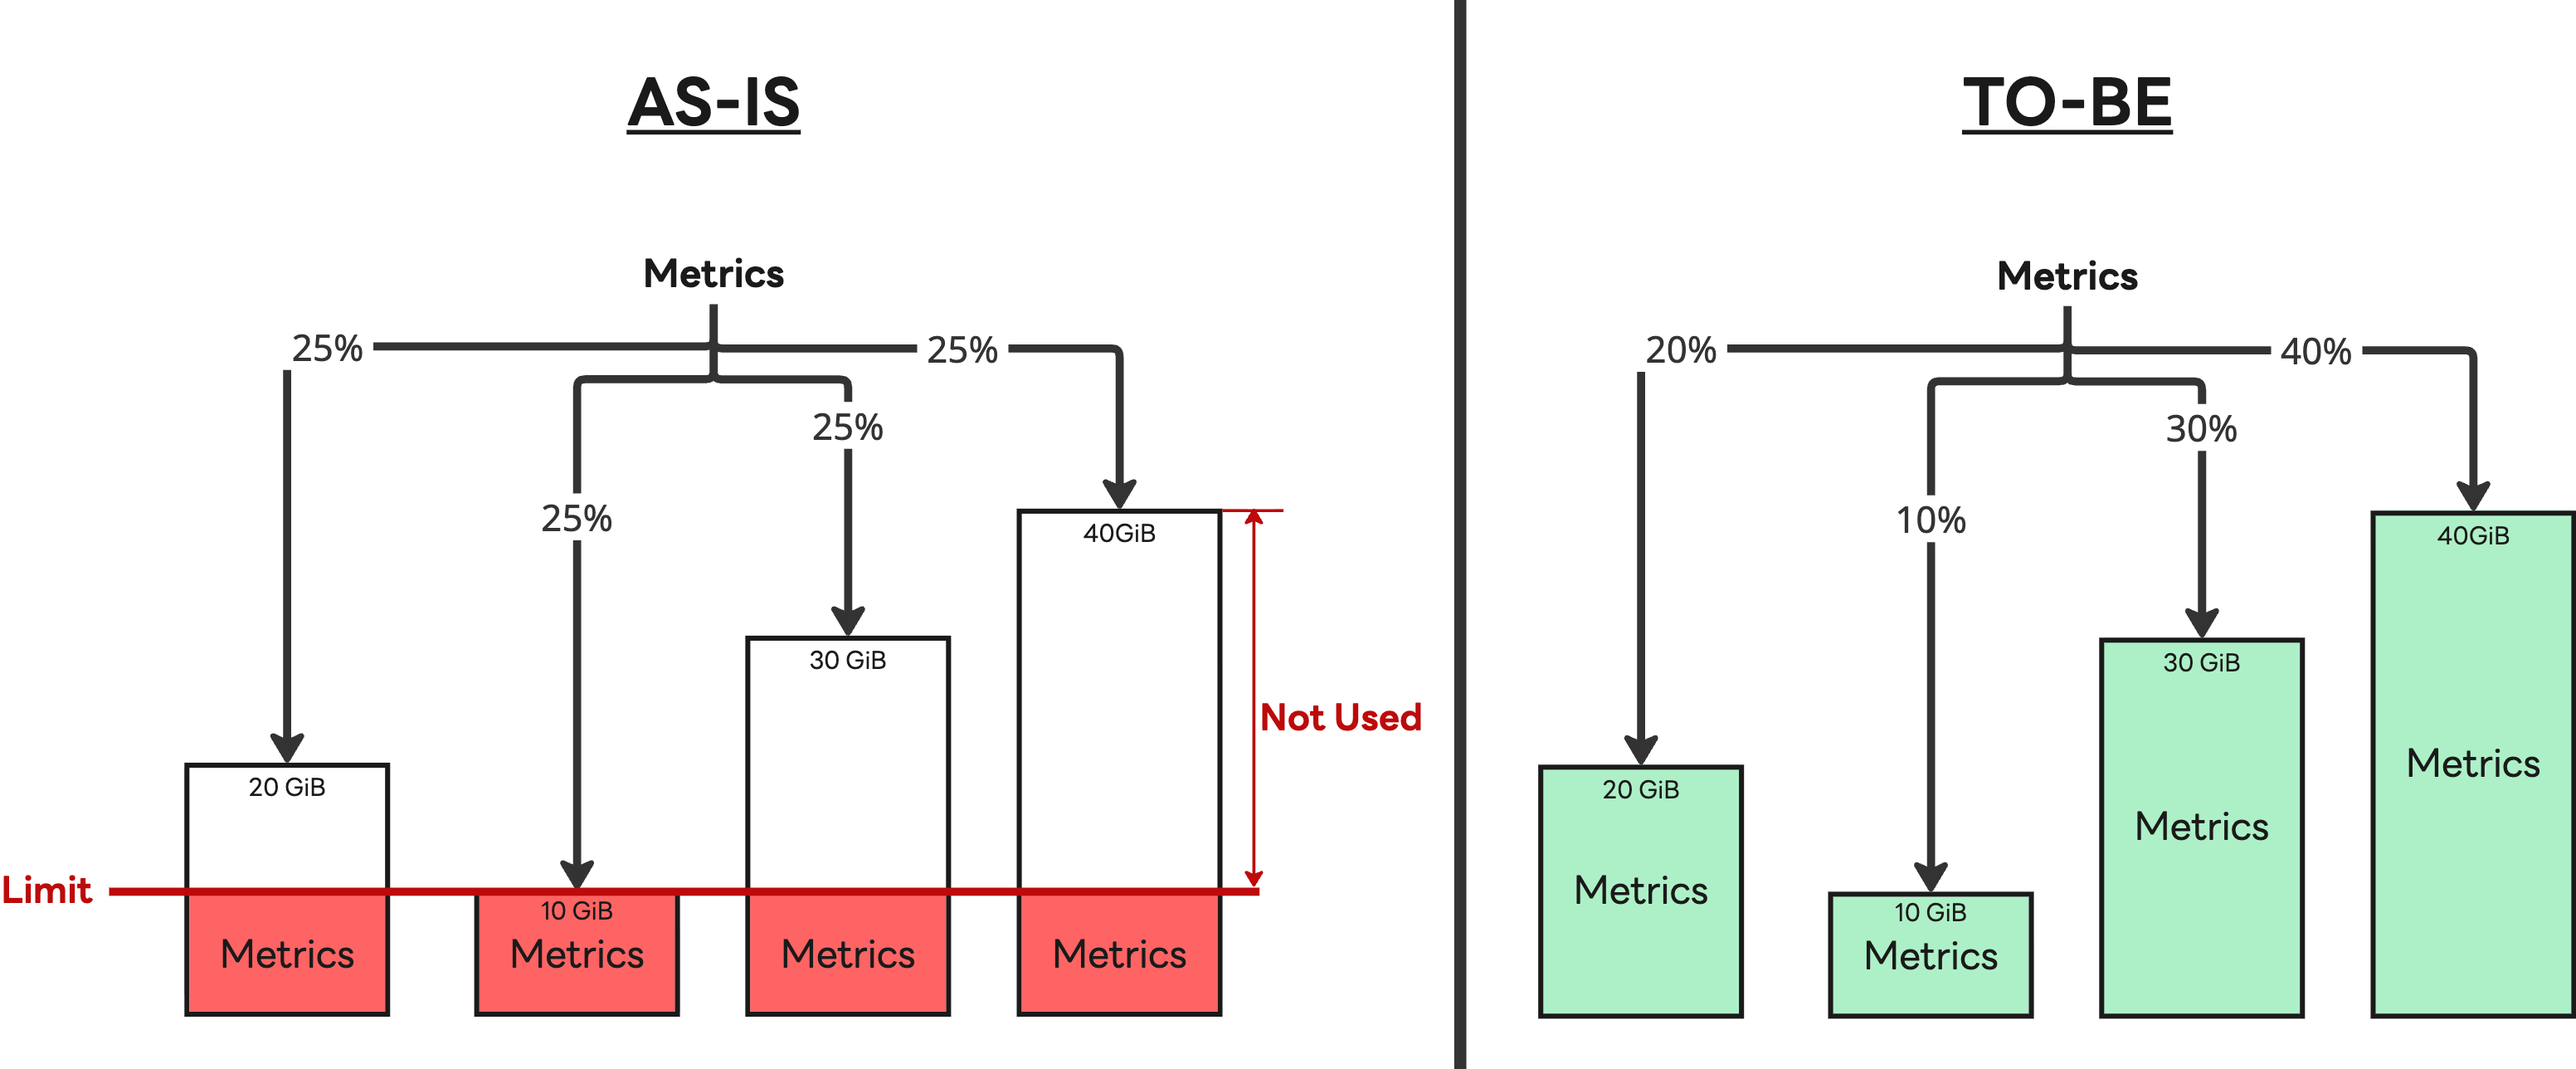
- Introduction of a tiered storage strategy: We abandoned the approach of storing all data in Cassandra. While fully migrating everything was considered for simplicity, we determined that, at least for now, an S3-compatible storage system (with cache) could not completely replace Cassandra’s performance. As a result, we adopted a hybrid structure where the most recent 14 days of data requiring high-performance processing remain in Cassandra, and older data is stored in S3.
This strategy proved effective. We gained the ability to flexibly add IMDB nodes with different specifications, allowing us to respond quickly to changes in the server market, while reducing our reliance on Cassandra to achieve better cost efficiency. The introduction of S3-compatible storage significantly reduced operational complexity, and by migrating major components to Kubernetes, we further improved operational efficiency.
As a result, our system has been reborn as a “giant dam” that can reliably contain (ingest) the flood of surging data and release it smoothly when needed (query). Thanks to this, we have maintained stable operations even amid the accelerated growth in large-scale metrics since 2024.
Technical challenges and collaboration behind the architectural shift
We wanted to provide users with the full scalability benefits of S3-compatible storage without burdening them with code changes (breaking changes). After much consideration, we introduced a tiered architecture that separates write and read responsibilities.
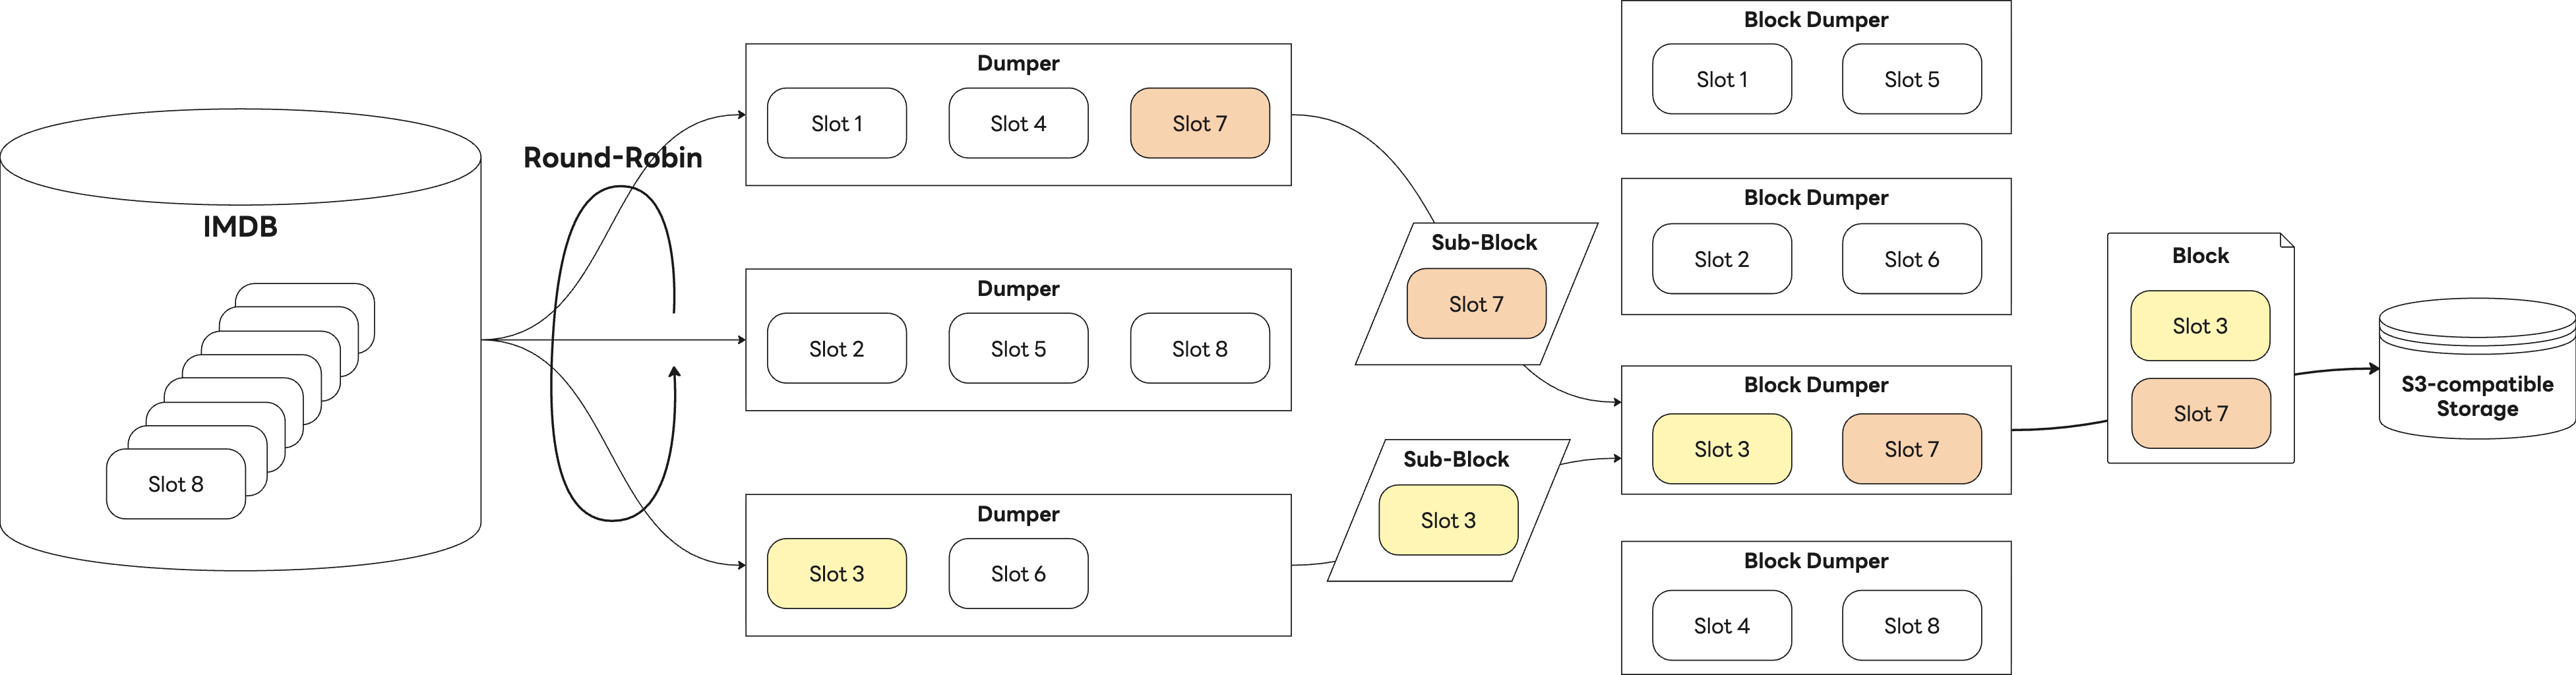
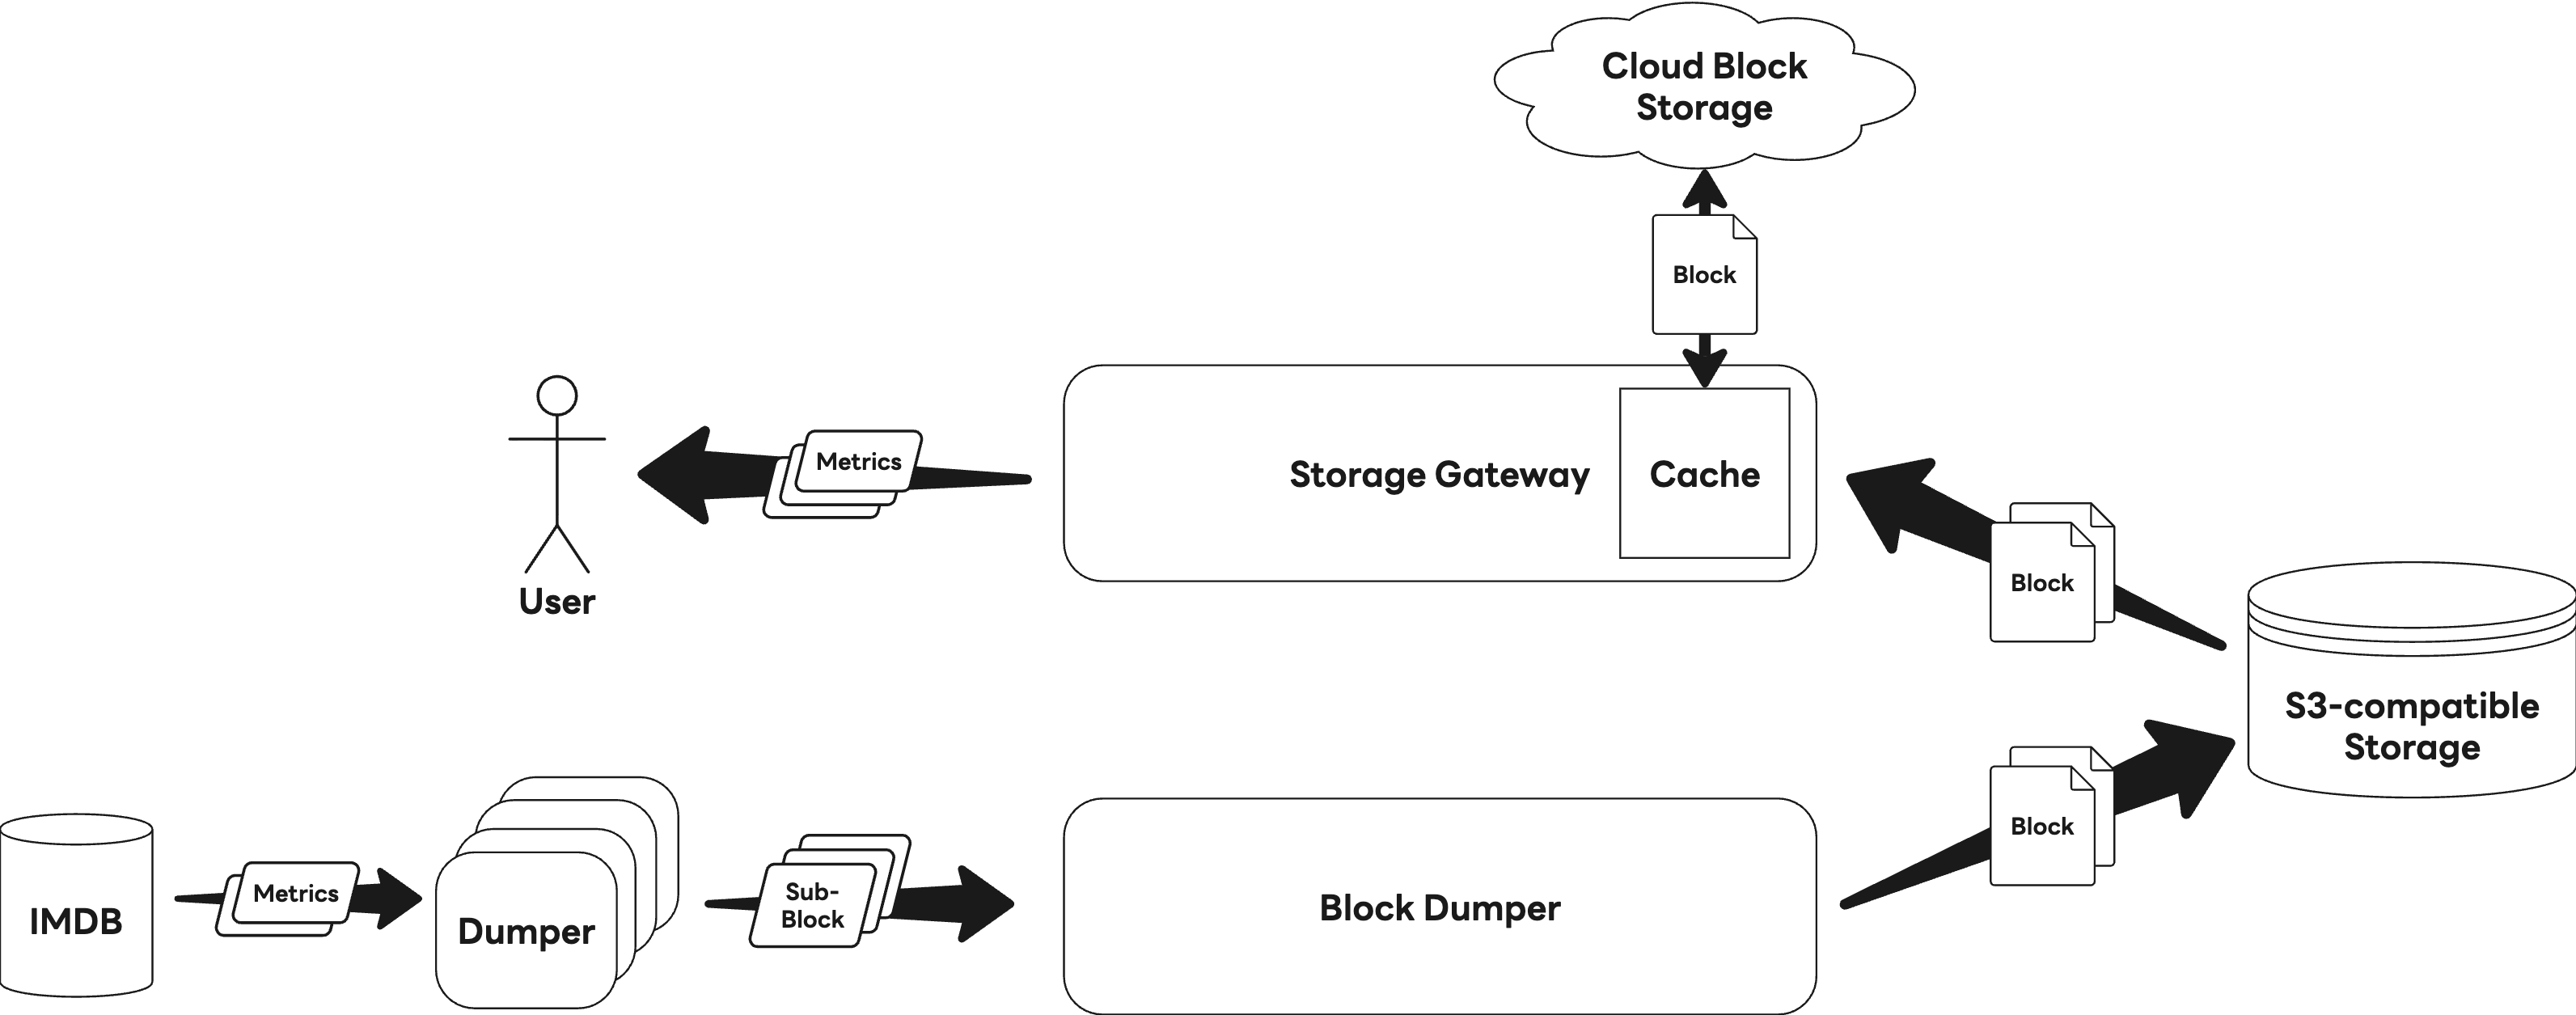
The write process is divided into two stages. First, a batch job component called the Dumper reads metric bundles, referred to as slots, from IMDB and converts them into sub-blocks based on our own defined format. Next, the Block Dumper aggregates these sub-blocks and packages them into a single block, which is then stored in S3. The diagram below shows the overall write process.
On the other hand, data reads are handled by the Storage Gateway, which reads and processes these blocks. The following diagram illustrates the overall read process.
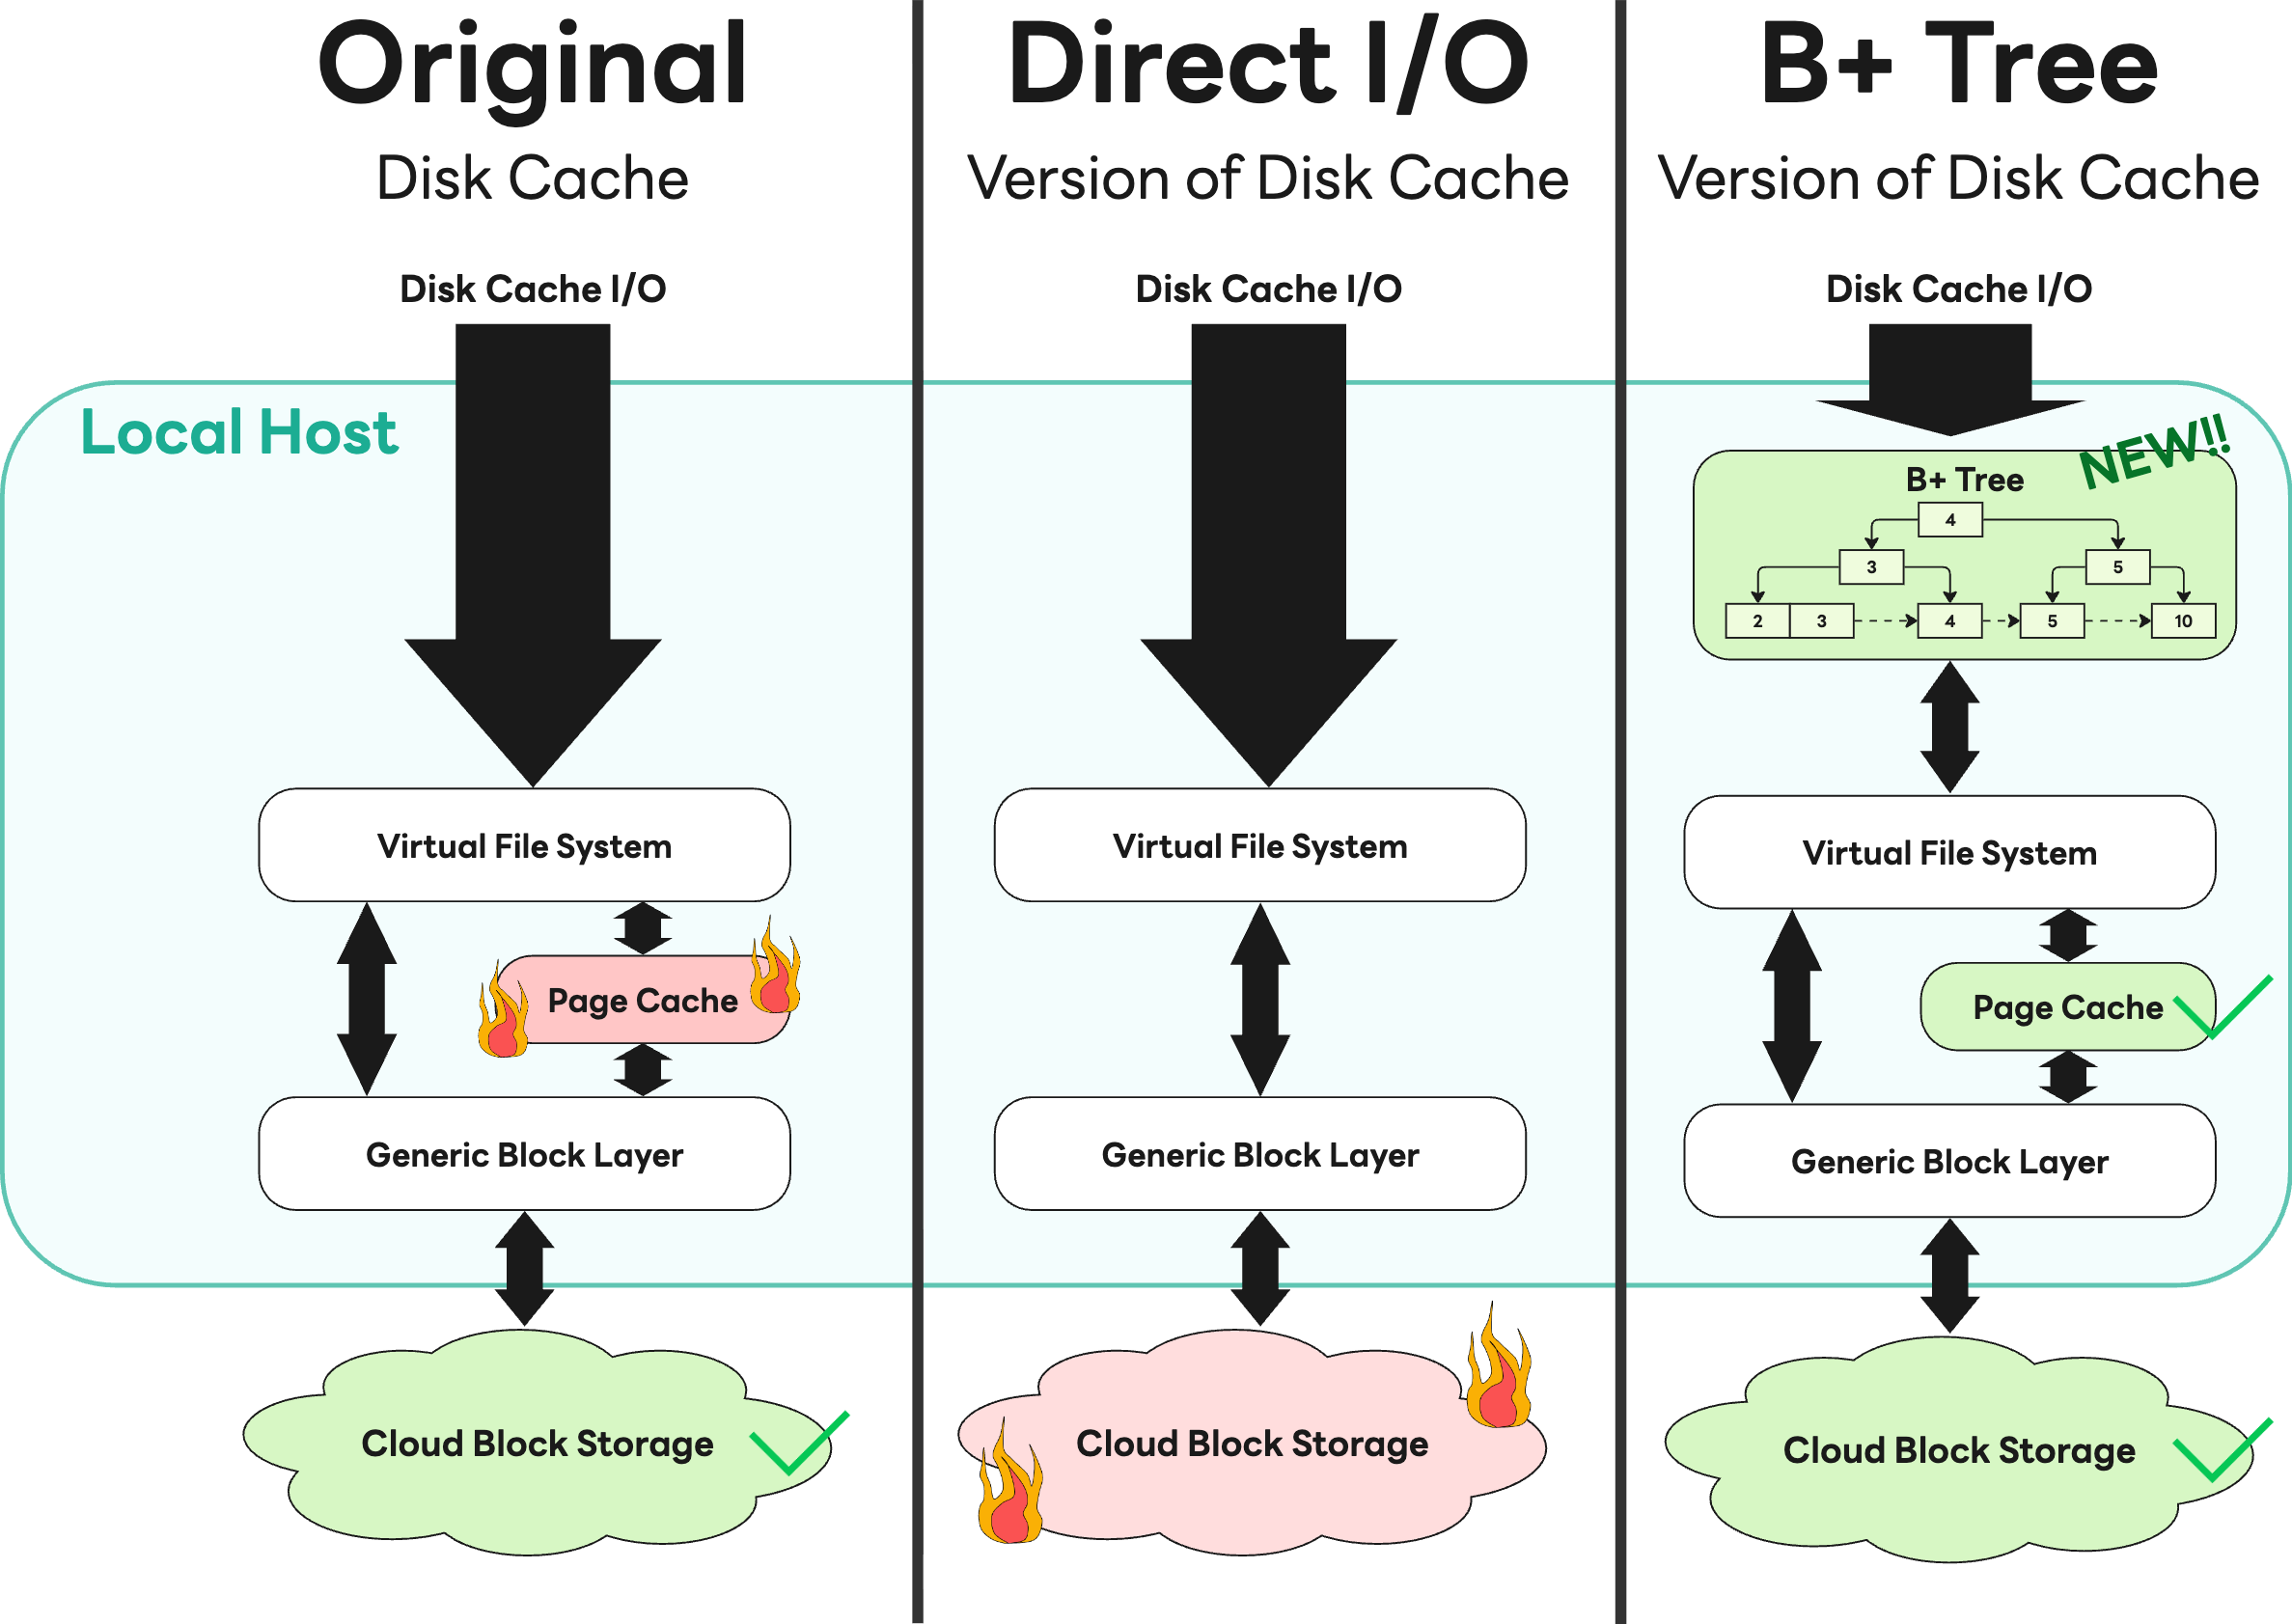
To maximize read performance, the Storage Gateway caches block data fetched from S3 onto disk. However, this cache caused a sharp increase in page cache usage during heavy I/O operations, ultimately leading to rapid memory exhaustion.
We initially attempted to solve this by applying direct I/O, but the internal cloud storage team urgently reported that it was consuming excessive bandwidth and affecting other services. We immediately shared the issue and collaborated closely with related teams. As a result, we rolled back the direct I/O approach and instead adopted a B+ tree-based cache that efficiently leverages the kernel’s page cache. This solution secured performance without placing undue strain on infrastructure, and it became a valuable experience that demonstrated how open communication about failures can lead to optimal outcomes.
Future plans: the time series database ahead
With the arrival of the AI era, the value of data is evolving from mere “recording” to “prediction” and “intelligence”. Accordingly, our team’s direction extends beyond simple storage toward higher-level utilization. To realize this prediction and intelligence, it is first necessary to consolidate time-series data that is currently stored in a fragmented manner across the organization.
However, we are well aware that if this integration process imposes migration burdens on users, it may represent technical progress but yield more harm than benefit from a business perspective. That is why we aim to once again apply the experience we have built over years of migrating trillions of records while preserving user experience. Based on this proven know-how, we plan to unify the various time series databases scattered across the organization into a single, in-house solution.
We expect this unified in-house platform to absorb the benefits of AI-driven innovation while enabling stable services, ultimately delivering the following value to users.
- Centralized platform: Bringing fragmented time-series data together in one place to create an environment where data analysts and engineers can access it at any time.
- Advanced AIOps and forecasting: Combining vast accumulated time-series data with AI models. We plan to provide intelligent endpoints that automatically detect anomalies and predict traffic changes, without requiring users to configure complex statistical settings.
- Model context protocol (MCP) integration: Building a standard interface that allows large language models (LLM) to easily understand and query operational data. We envision a future where users can ask, “What caused last week’s traffic anomaly?”, and the system analyzes the data to provide an answer.
Our challenge does not stop here. The observability platform continues to evolve every day, striving to become a solid foundation that supports the technological growth of LY Corporation.
References
- Majors, C., Fong-Jones, L., & Miranda, G. (2022). Observability Engineering. O'Reilly Media.
- Naqvi, S. N. Z., Yfantidou, S., & Zimányi, E. (2017). Time series databases and influxdb. Studienarbeit, Université Libre de Bruxelles, 12, 1-44.
- Pelkonen, T., Franklin, S., Teller, J., Cavallaro, P., Huang, Q., Meza, J., & Veeraraghavan, K. (2015). Gorilla: A fast, scalable, in-memory time series database. Proceedings of the VLDB Endowment, 8(12), 1816-1827.
- Dunning, T., & Friedman, E. (2015). Time Series Databases: New Ways to Store and Access Data. O'Reilly Media.
- OpenTSDB. (n.d.). Writing data. https://opentsdb.net/docs/build/html/user_guide/writing/index.html#naming-conclusion