Hello. We are ML engineers Jin Woo Baek and Chang Hyun Lee developing the LINE VOOM services recommendation system. Weve undertaken a project to implement a large-scale vector database for the LINE VOOMs real-time recommendation system. In this post, we aim to introduce this process in detail.
What is LINE VOOM?
First, let us introduce the service were developing. LINE VOOM is a video content-centric social network service offered within the LINE app. It is currently available for use in Japan, Taiwan, Thailand, and more.
In LINE VOOM, anyone can become a content creator and upload content, while users can explore and consume various content. In the For you tab, users can continuously watch videos they might find interesting, and in the Following tab, they can collect and view content from creators they follow.

This article primarily focuses on the recommendation process offered in the For you tab. The For you tab provides users with personalized content recommendation results. It extracts and provides content that users are likely to prefer based on feedback such as previously watched, clicked, or liked content.
Problems of the existing recommendation system
The entire operation flow of the previously used recommendation system is as follows:
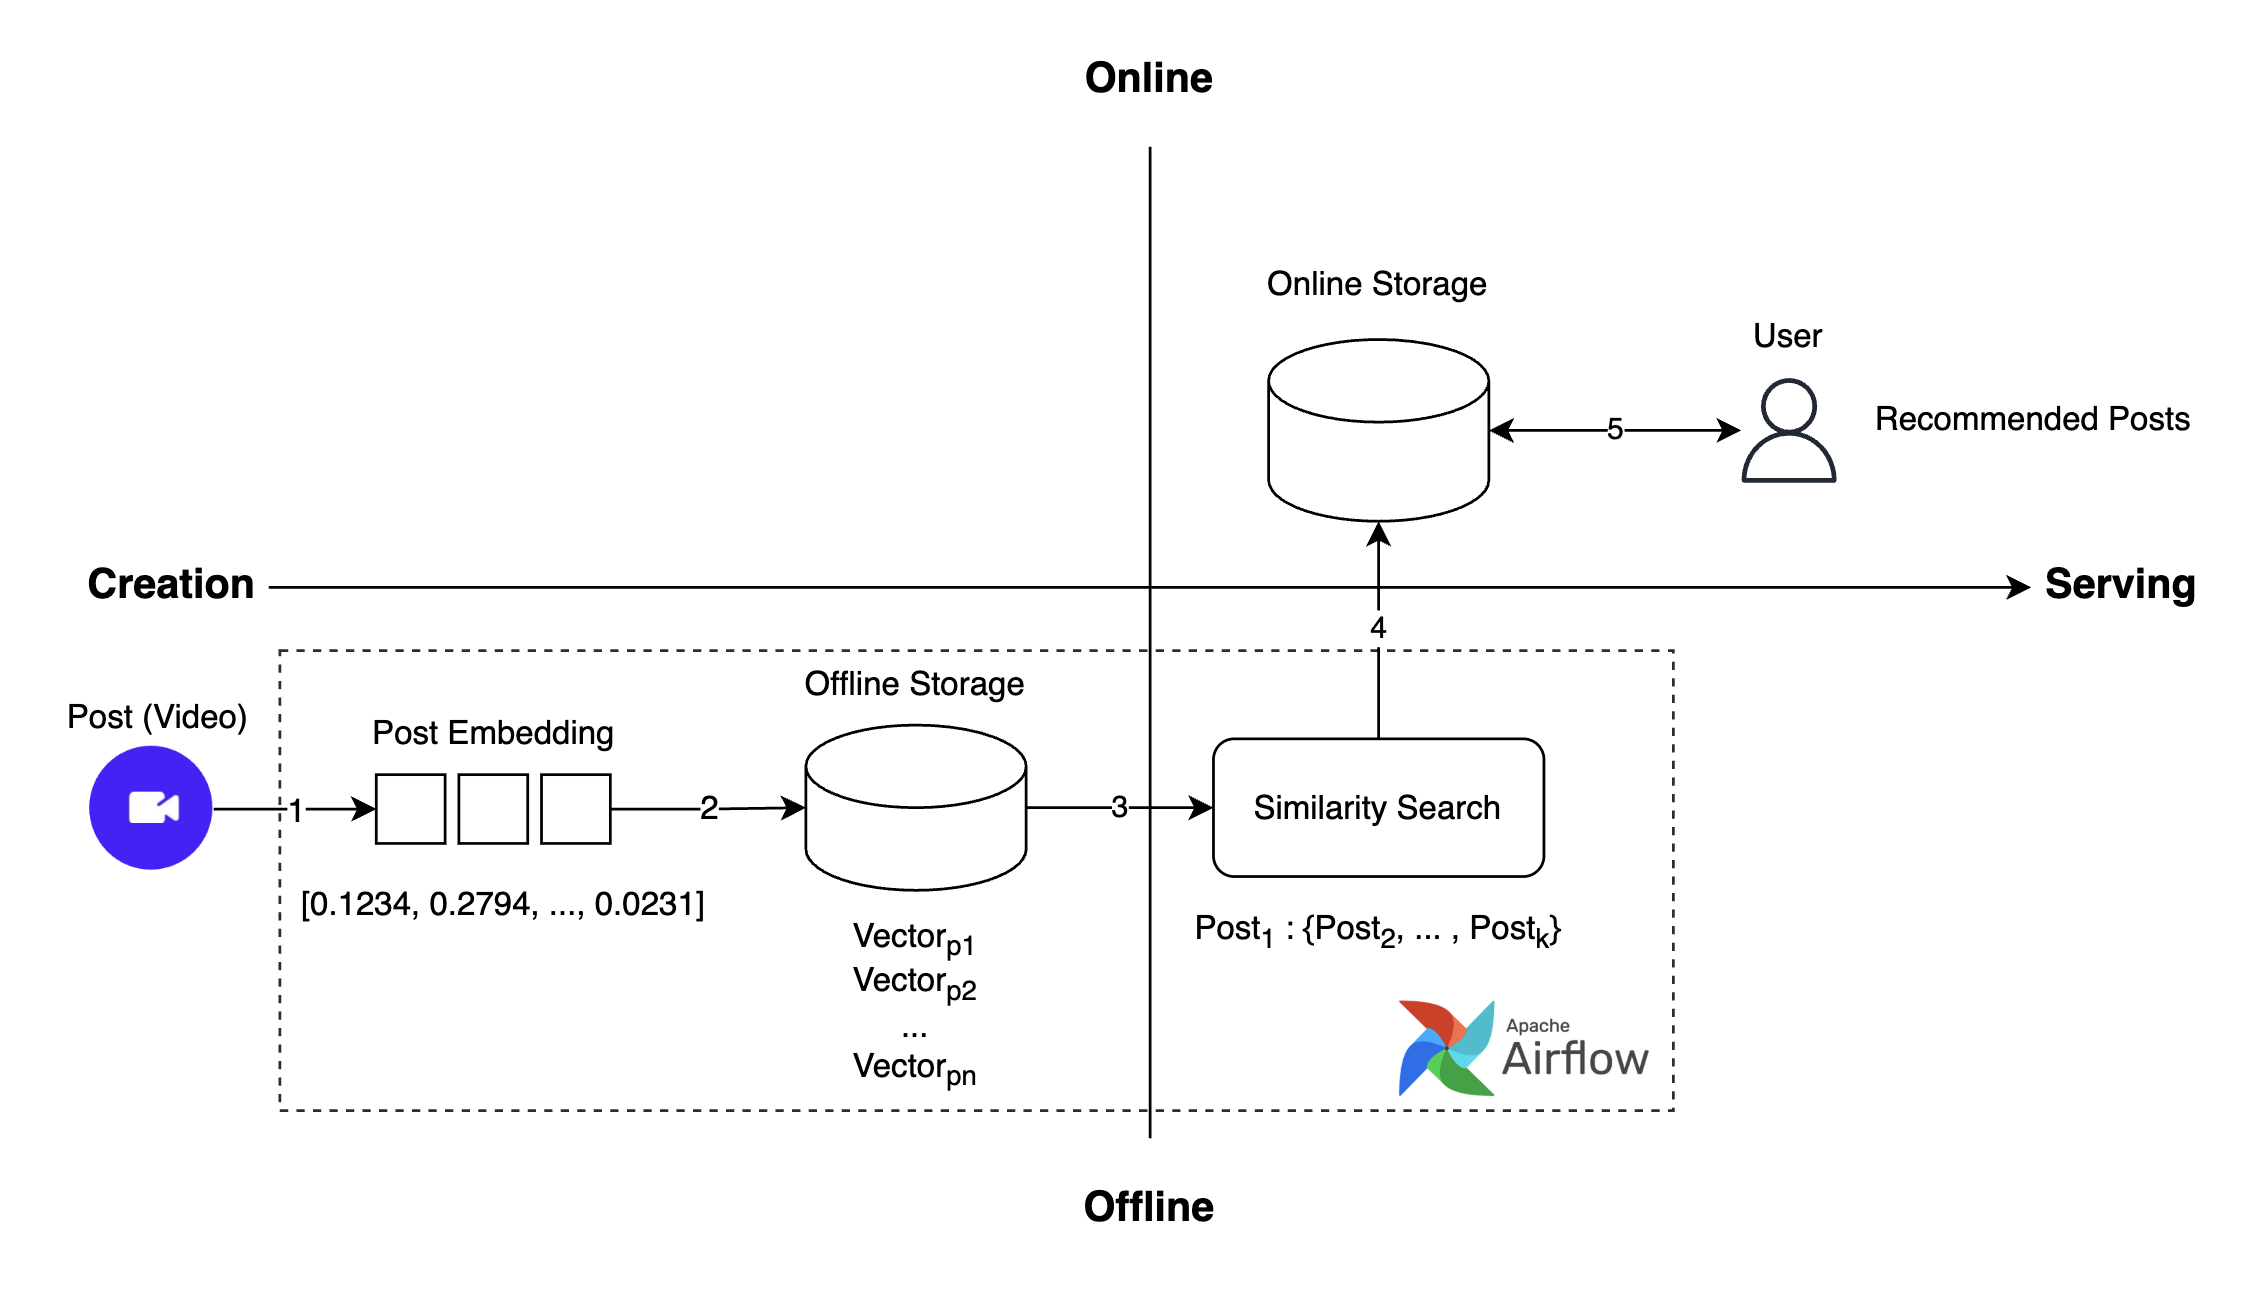
- Post creation: Users create video posts.
- Post embedding generation: Embedding is generated for the created post.
- Post embedding storage: The generated embedding is stored in the vector database.
- Similar post search: Finds similar posts through similarity search using approximate nearest neighbor (ANN).
- Request and get recommended posts: Provides recommended posts to the user.
This process allowed users to easily access various content according to their interests, but there was one problem.
Problem: Lack of immediacy
The existing recommendation system processed embedding generation, storage, and candidate extraction as a daily offline batch operation. This limitation caused up to a day delay in updating recommender candidates, impacting user experience as follows:
- When Creator A posts a New Years video titled "Happy New Year", its not immediately recommended to users.
- When Creator B shares a soccer World Cup goal scene, it too isnt immediately recommended.
The inability to immediately see fresh content, the "lack of immediacy" issue, deteriorated user experience. To address this, it was necessary to improve the system, and a project to implement a real-time recommendation system began.
The projects goal was to reflect user-posted content immediately as recommendation candidates to recommend fresher posts. The system was changed significantly, switching from daily candidate pool generation to model-based real-time candidate generation and from offline to online vector search operations.
This article focuses on the changes made to the vector search structure.
Structure of the new real-time recommendation system and why vector DB was needed
The overall operating flow of the newly developed real-time recommendation system is as follows:
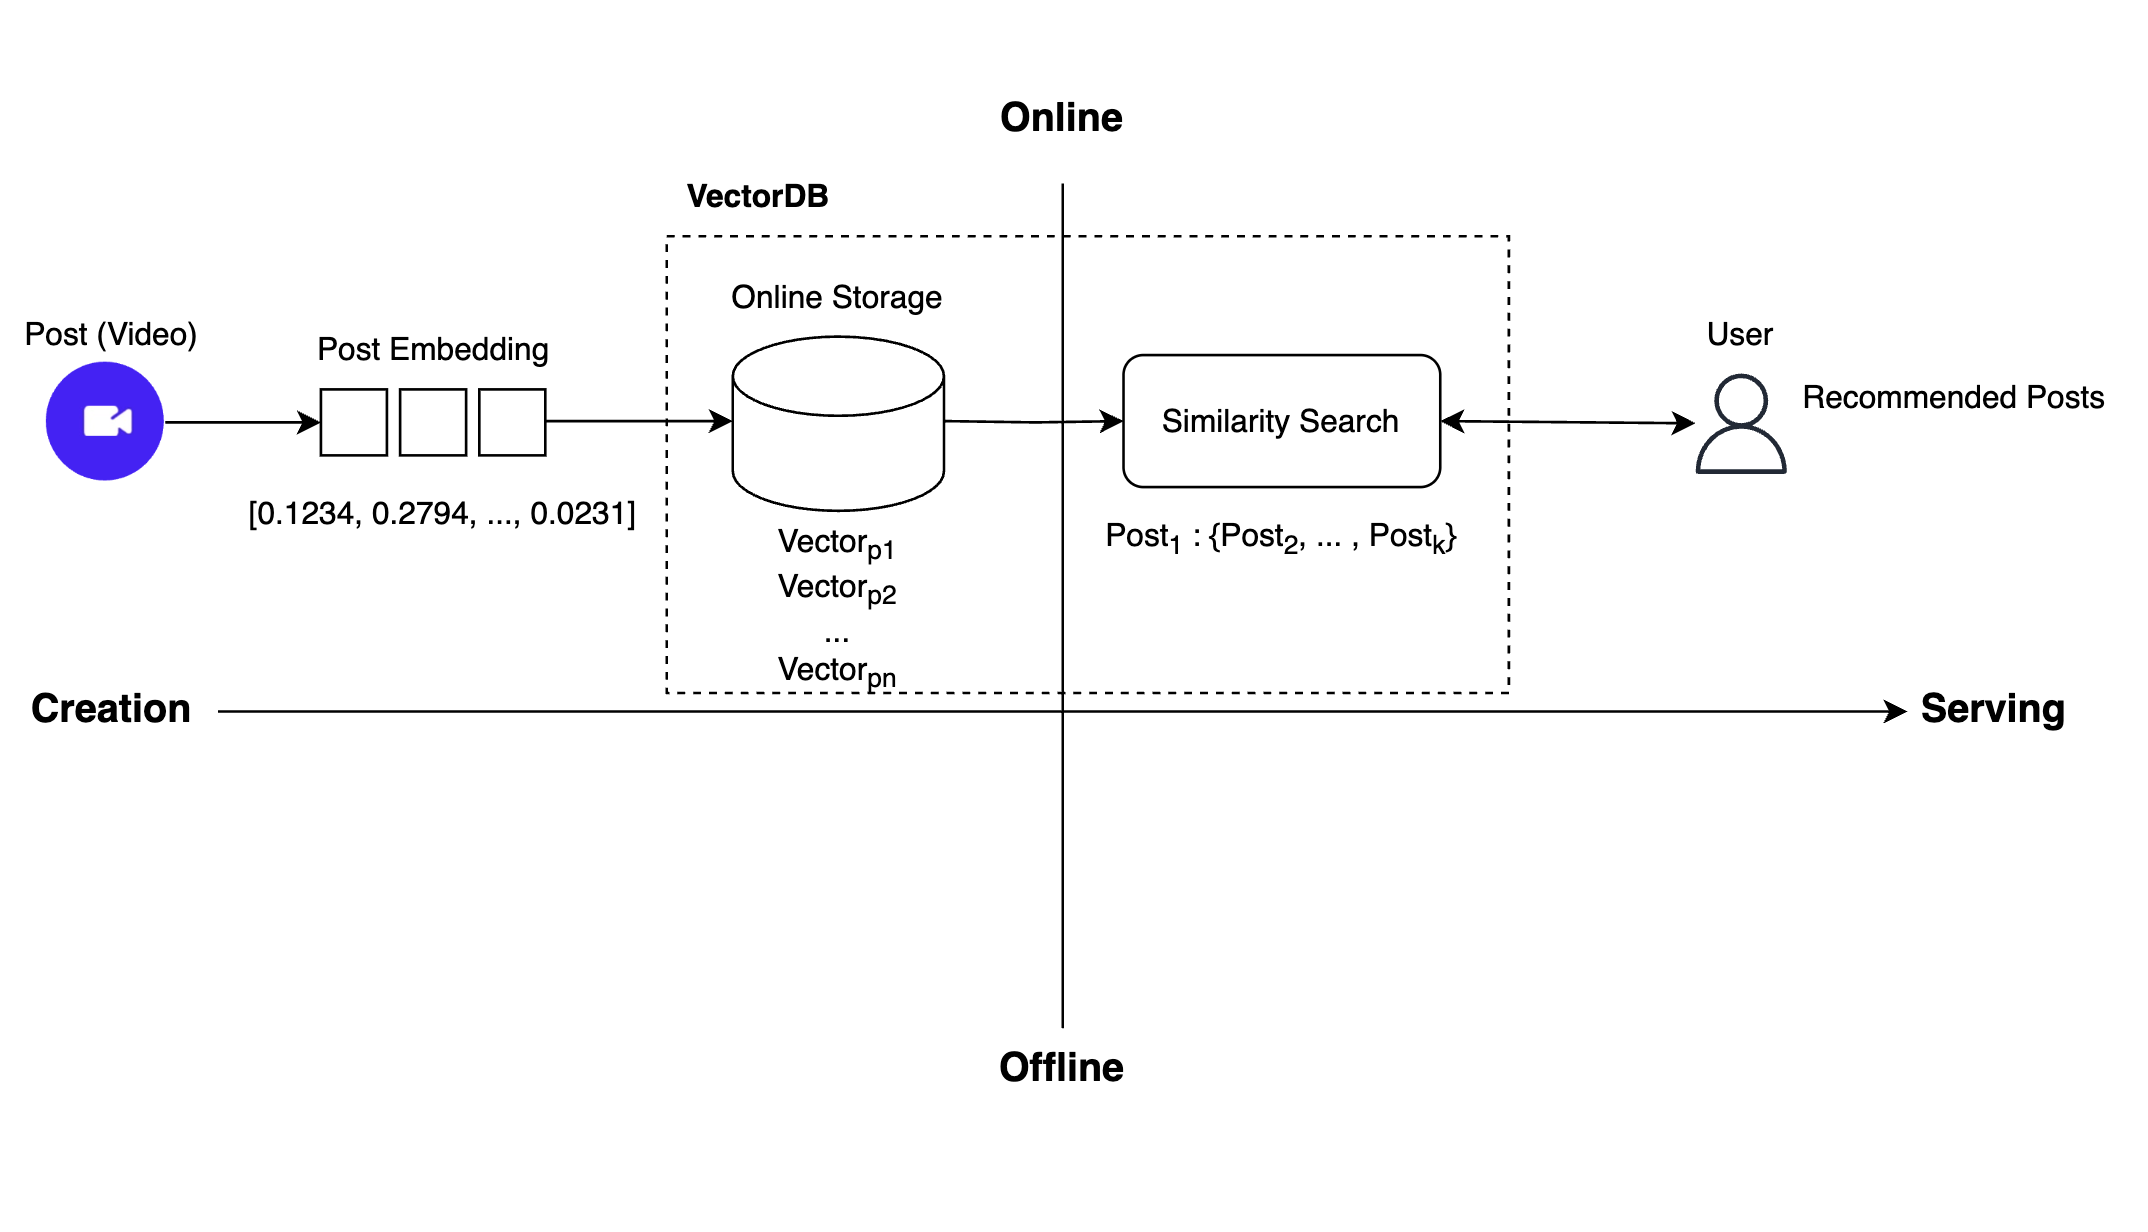
To implement real-time recommendations as above, tasks previously performed offline in the recommendation system had to be converted to online operations. Two tasks were necessary: First, we needed to switch the space for storing post embeddings from an offline to an online storage. Second, previously all posts eligible for recommendation were pre-searched offline and stored online; now, immediate similarity searches must be performed without intermediate storage.
We believed that to implement these two functions—online storage and real-time similarity search—a vector DB was needed, and we began exploring various vector DB platforms.
Heres a summary of the process so far:
- The existing recommendation system performed similarity searches using offline storage and batch processing, causing a lack of immediacy.
- The primary problem was the full-day delay before a post could be included in the recommendation candidates, preventing immediate content delivery.
- To solve this, we decided to turn all offline operations online. This required storing post embeddings online and performing real-time similarity searches without intermediate processes.
- A vector DB was needed to handle real-time storage and similarity processing.
Criteria for selecting vector DB and why Milvus was chosen
With the recent development of the vector DB ecosystem, many options have emerged. To select a suitable platform, we established several criteria:
- It must be a dedicated vector DB.
- It must be open source.
- It must be deployable on-premises.
- It must operate stably under high load with low latency for real-time recommendations.
When exploring under these criteria, the appropriate frameworks were Milvus and Qdrant. Lets compare these two frameworks.
| Criteria | Milvus | Qdrant |
|---|---|---|
| Performance (QPS (queries per second), latency)(reference) | 2406 req/s, 1ms | 326 req/s, 4ms |
| Storage/compute separation | O | X |
| Stream and batch support | O | X |
| GitHub stars (indicative of community size and activity) | 35.9K stars | 24.6K stars |
| Number of supported in-memory index types | 10 (reference) | 1 (HNSW only) |
Milvus showed superior performance compared to Qdrant and offered higher stability through storage and compute separation. It also supported various index algorithms, allowing optimization via multiple experiments tailored to our scenarios. It supports online INSERT and offline bulk INSERT, which means features to respond to embedding updates can be implemented, and the active community makes it easy to get information when issues arise.
For these reasons, we decided to opt for Milvus.
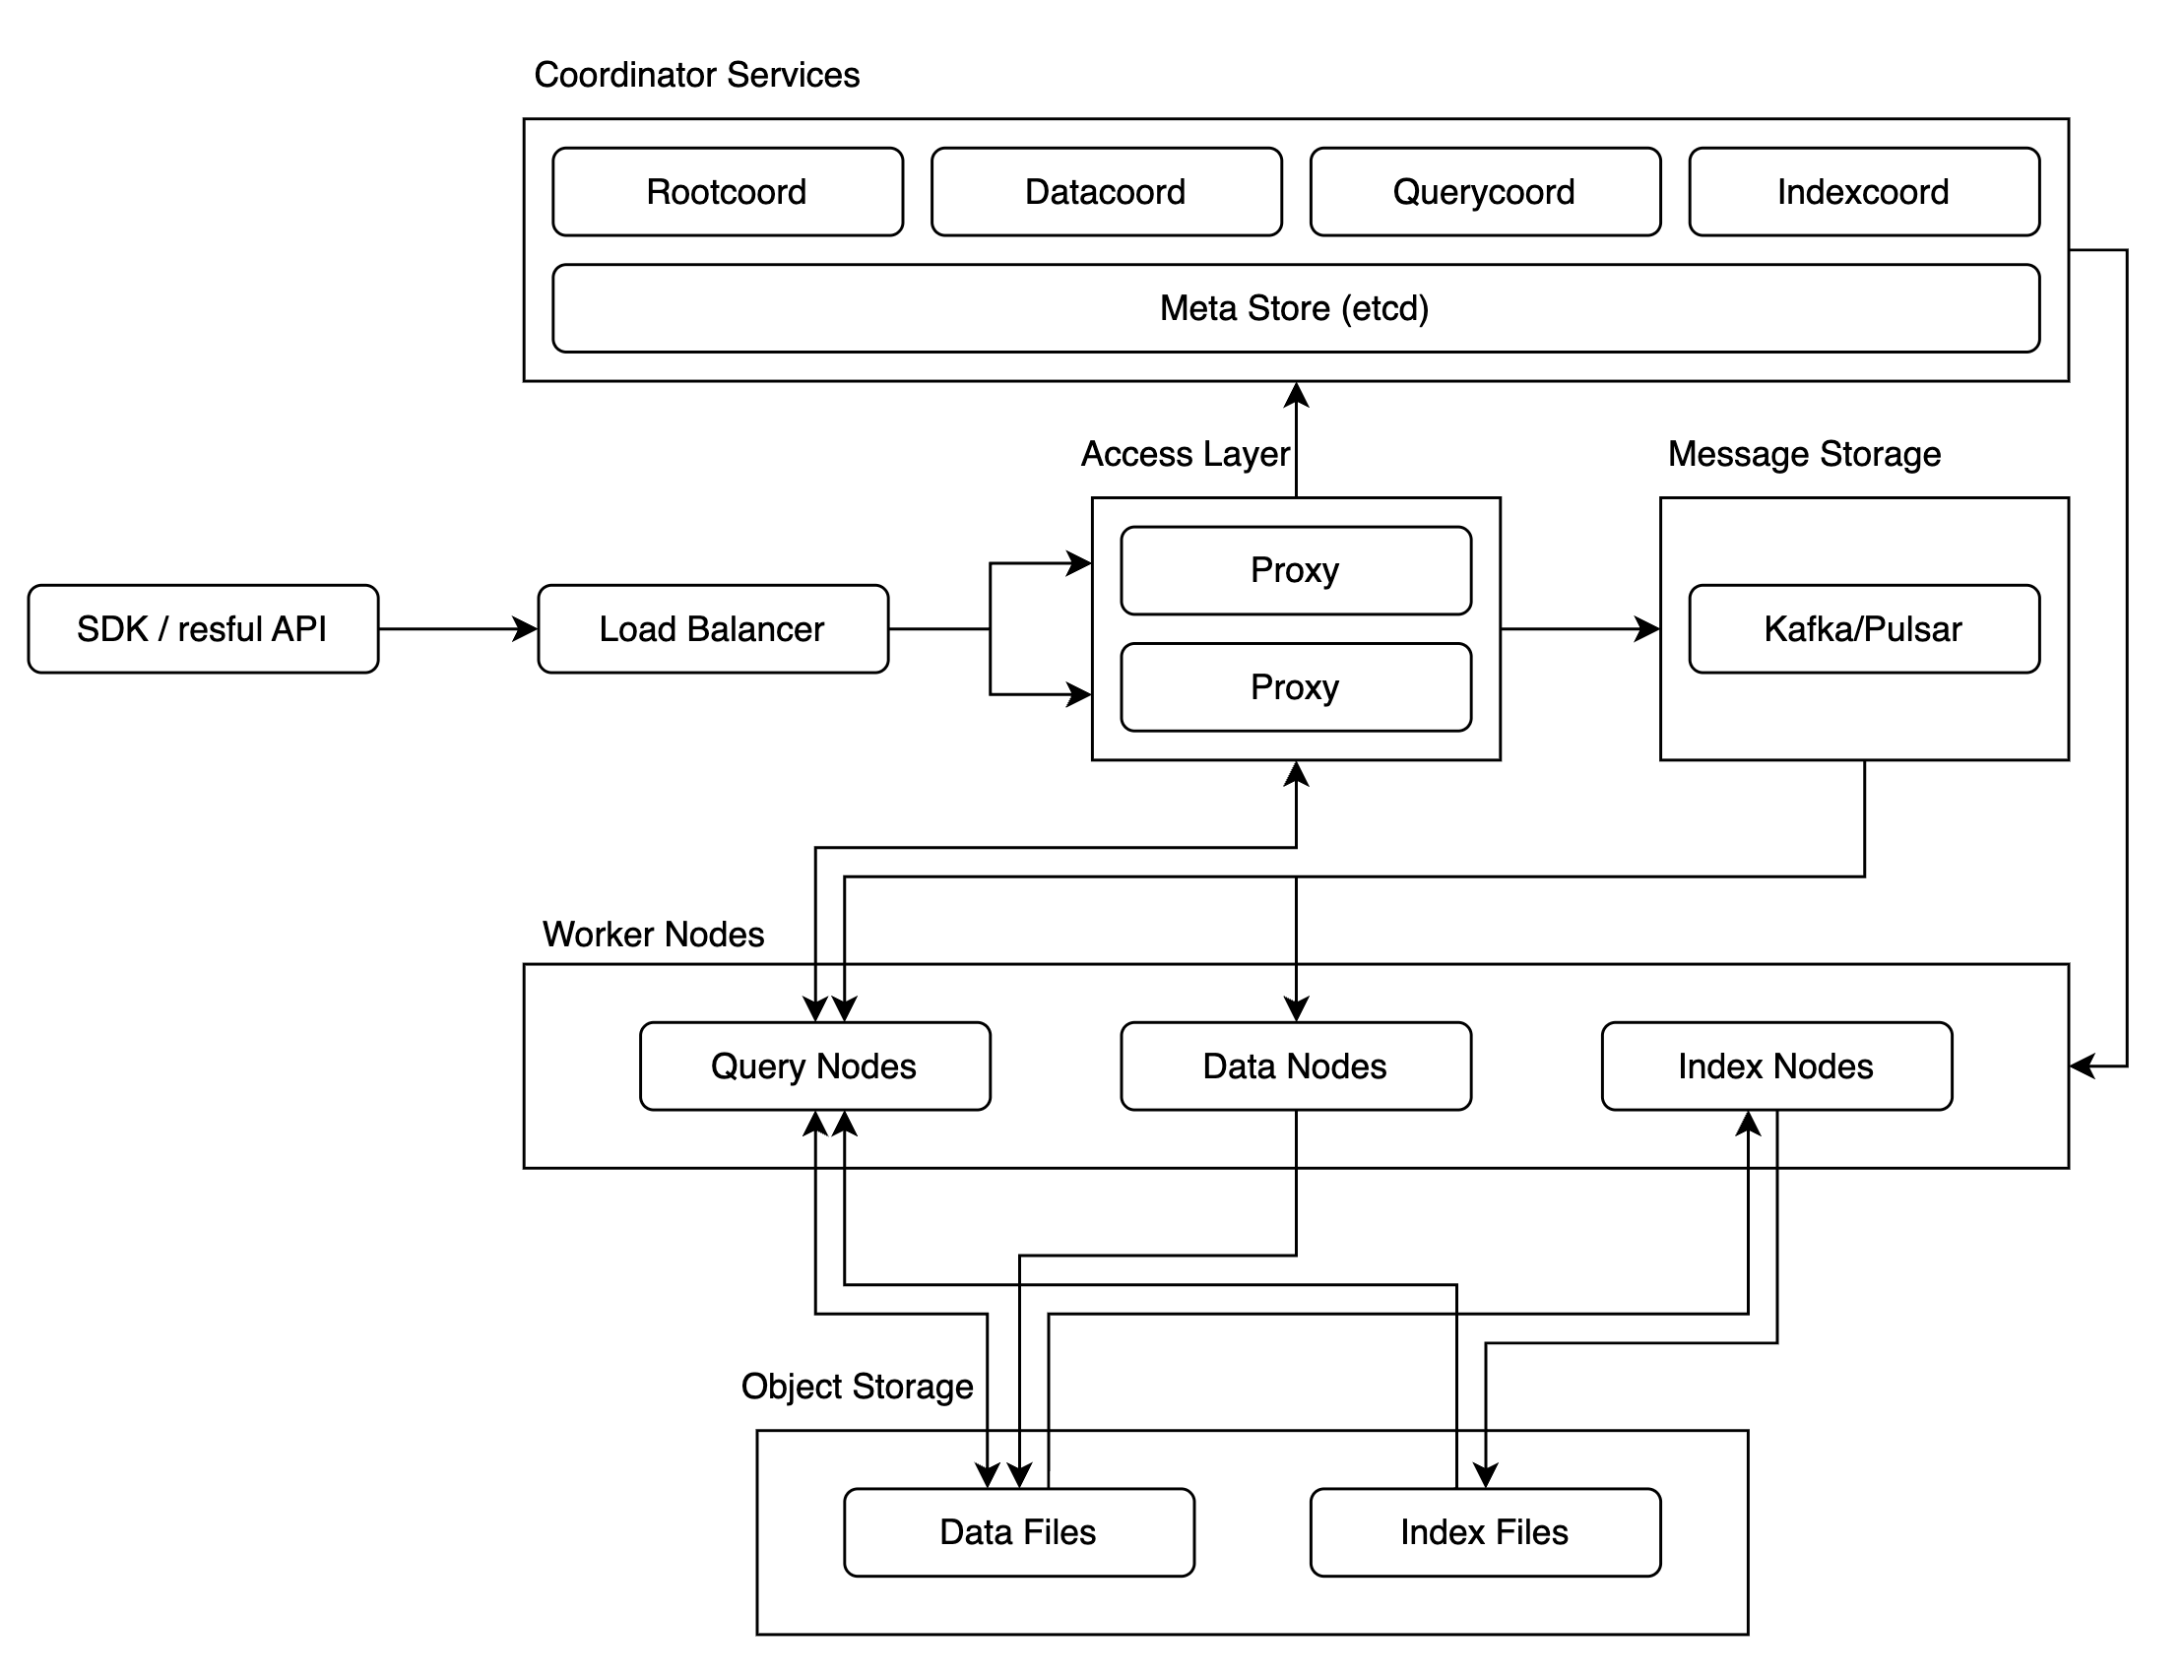
Introduction to Milvus
Milvus is designed for similarity searches for more than a billion vector data, and due to this, its structure is complex. As it was aimed at massive vector data similarity searches, few public use cases exist for the cluster version, leaving performance and stability somewhat uncertain.
To clear up this uncertainty and successfully adopt Milvus, we needed thorough verification of its performance and stability, which we achieved via chaos tests and performance tests.
During the chaos test, our focus was on checking how stably the system operates and determining how to stabilize it if operating unstably.
In the performance test, we focused on reproducing the vector search performance from the ANN benchmark on our infrastructure and understanding how to maximize throughput and minimize response times with limited resources.
Lets review each test method and result in detail.
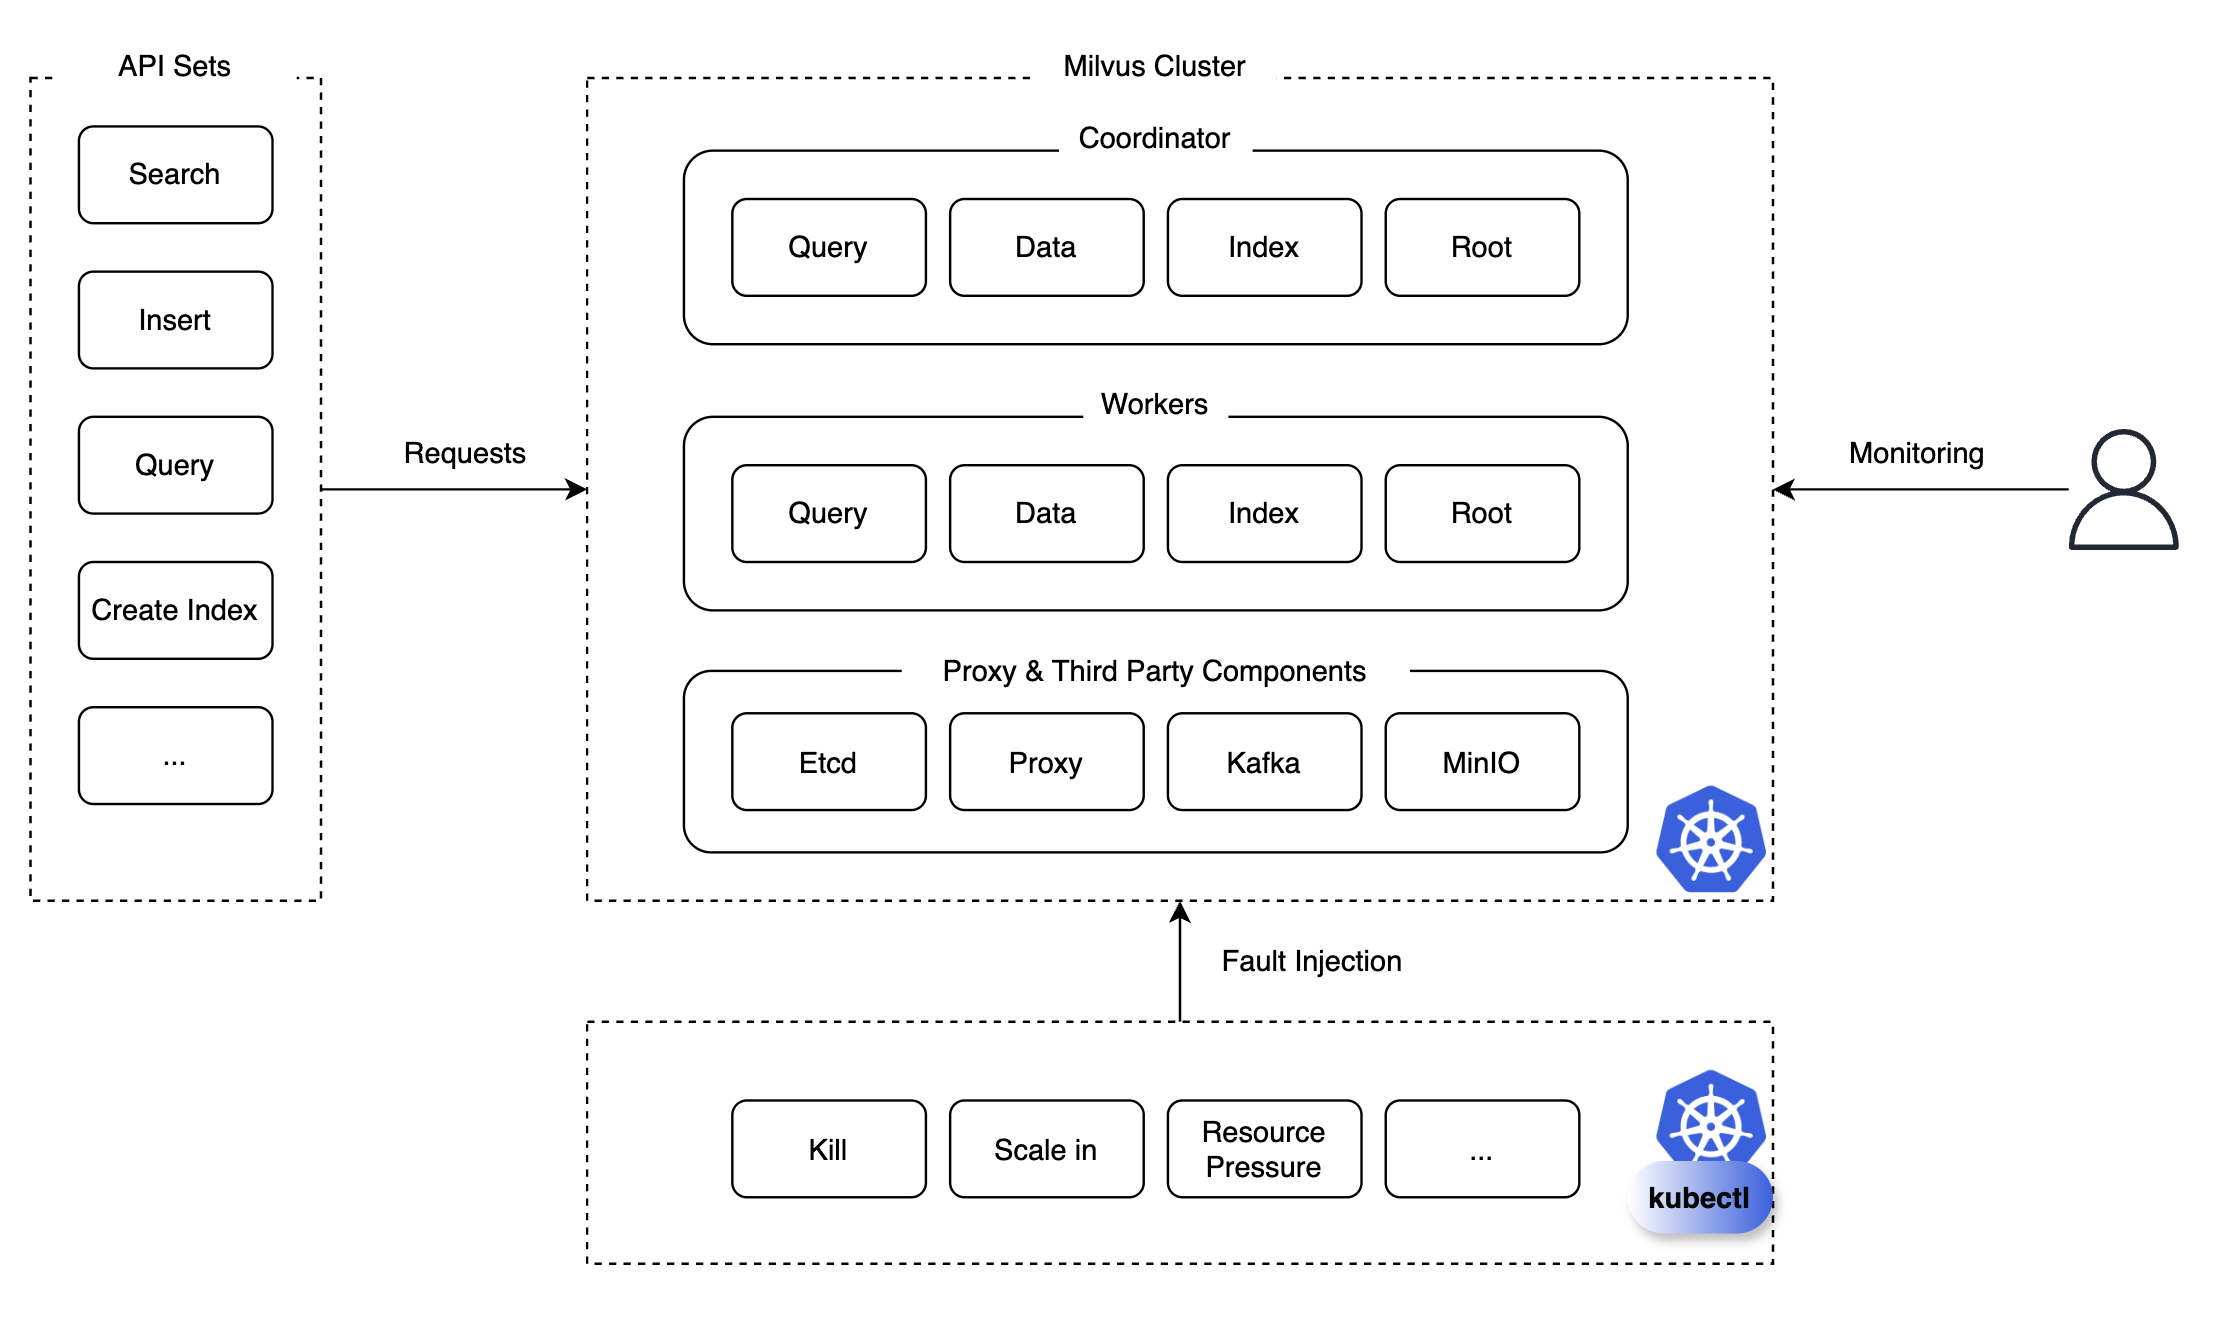
Milvus verification 1: Chaos test
A chaos test is a testing method that deliberately introduces chaos to assess system stability and resilience. We prepared a set of APIs like query, search, insert, delete, index creation, load, release, etc., and consistently or repeatedly sent specific API requests to the Milvus cluster, injecting scenarios like pod kill, scale-in/out/up, and monitored their effects.
We meticulously monitored and reviewed whether the components could recover, the required time for recovery, and pre-problem occurrences. Thanks to this monitoring, we discovered and took preventive measures against potential future failures. Lets analyze the test results and outline issues we addressed.
Test results
Below is a table summarizing key results from the test:
| API | Chaos scenario | Result |
|---|---|---|
| Search | Scale in Querynode | Normal operation |
| Search | Scale out Querynode | Normal operation |
| Search | Kill Querynode | Normal operation |
| Search | Kill Querycoord | Collection is released, rendering similarity searches unavailable |
| Search | Kill Etcd (more than half) | Cluster down, metadata loss prevents lookup of specific collections |
| ... | ... | ... |
| Insert | Kill Datanode | Normal operation |
| Insert | Kill Querynode | Normal operation |
| Insert | Kill Proxy | Normal operation |
| Create Index | Kill Indexcoord | Failed to create index, took 102 seconds to recover |
Scenarios marked in red are critical issues that could lead to service failures, necessitating measures to increase stability. Lets introduce some solutions implemented to enhance Milvuss system stability.
Configuring high availability at the collection level
First, to prevent situations similar to the Kill Querycoord scenario where the collection suddenly releases rendering similarity search unavailable, we created a backup collection and implemented dual writing for high availability (HA) at the collection level. Clients searching vectors from collections used aliases to switch references instantly if any collections became unavailable.
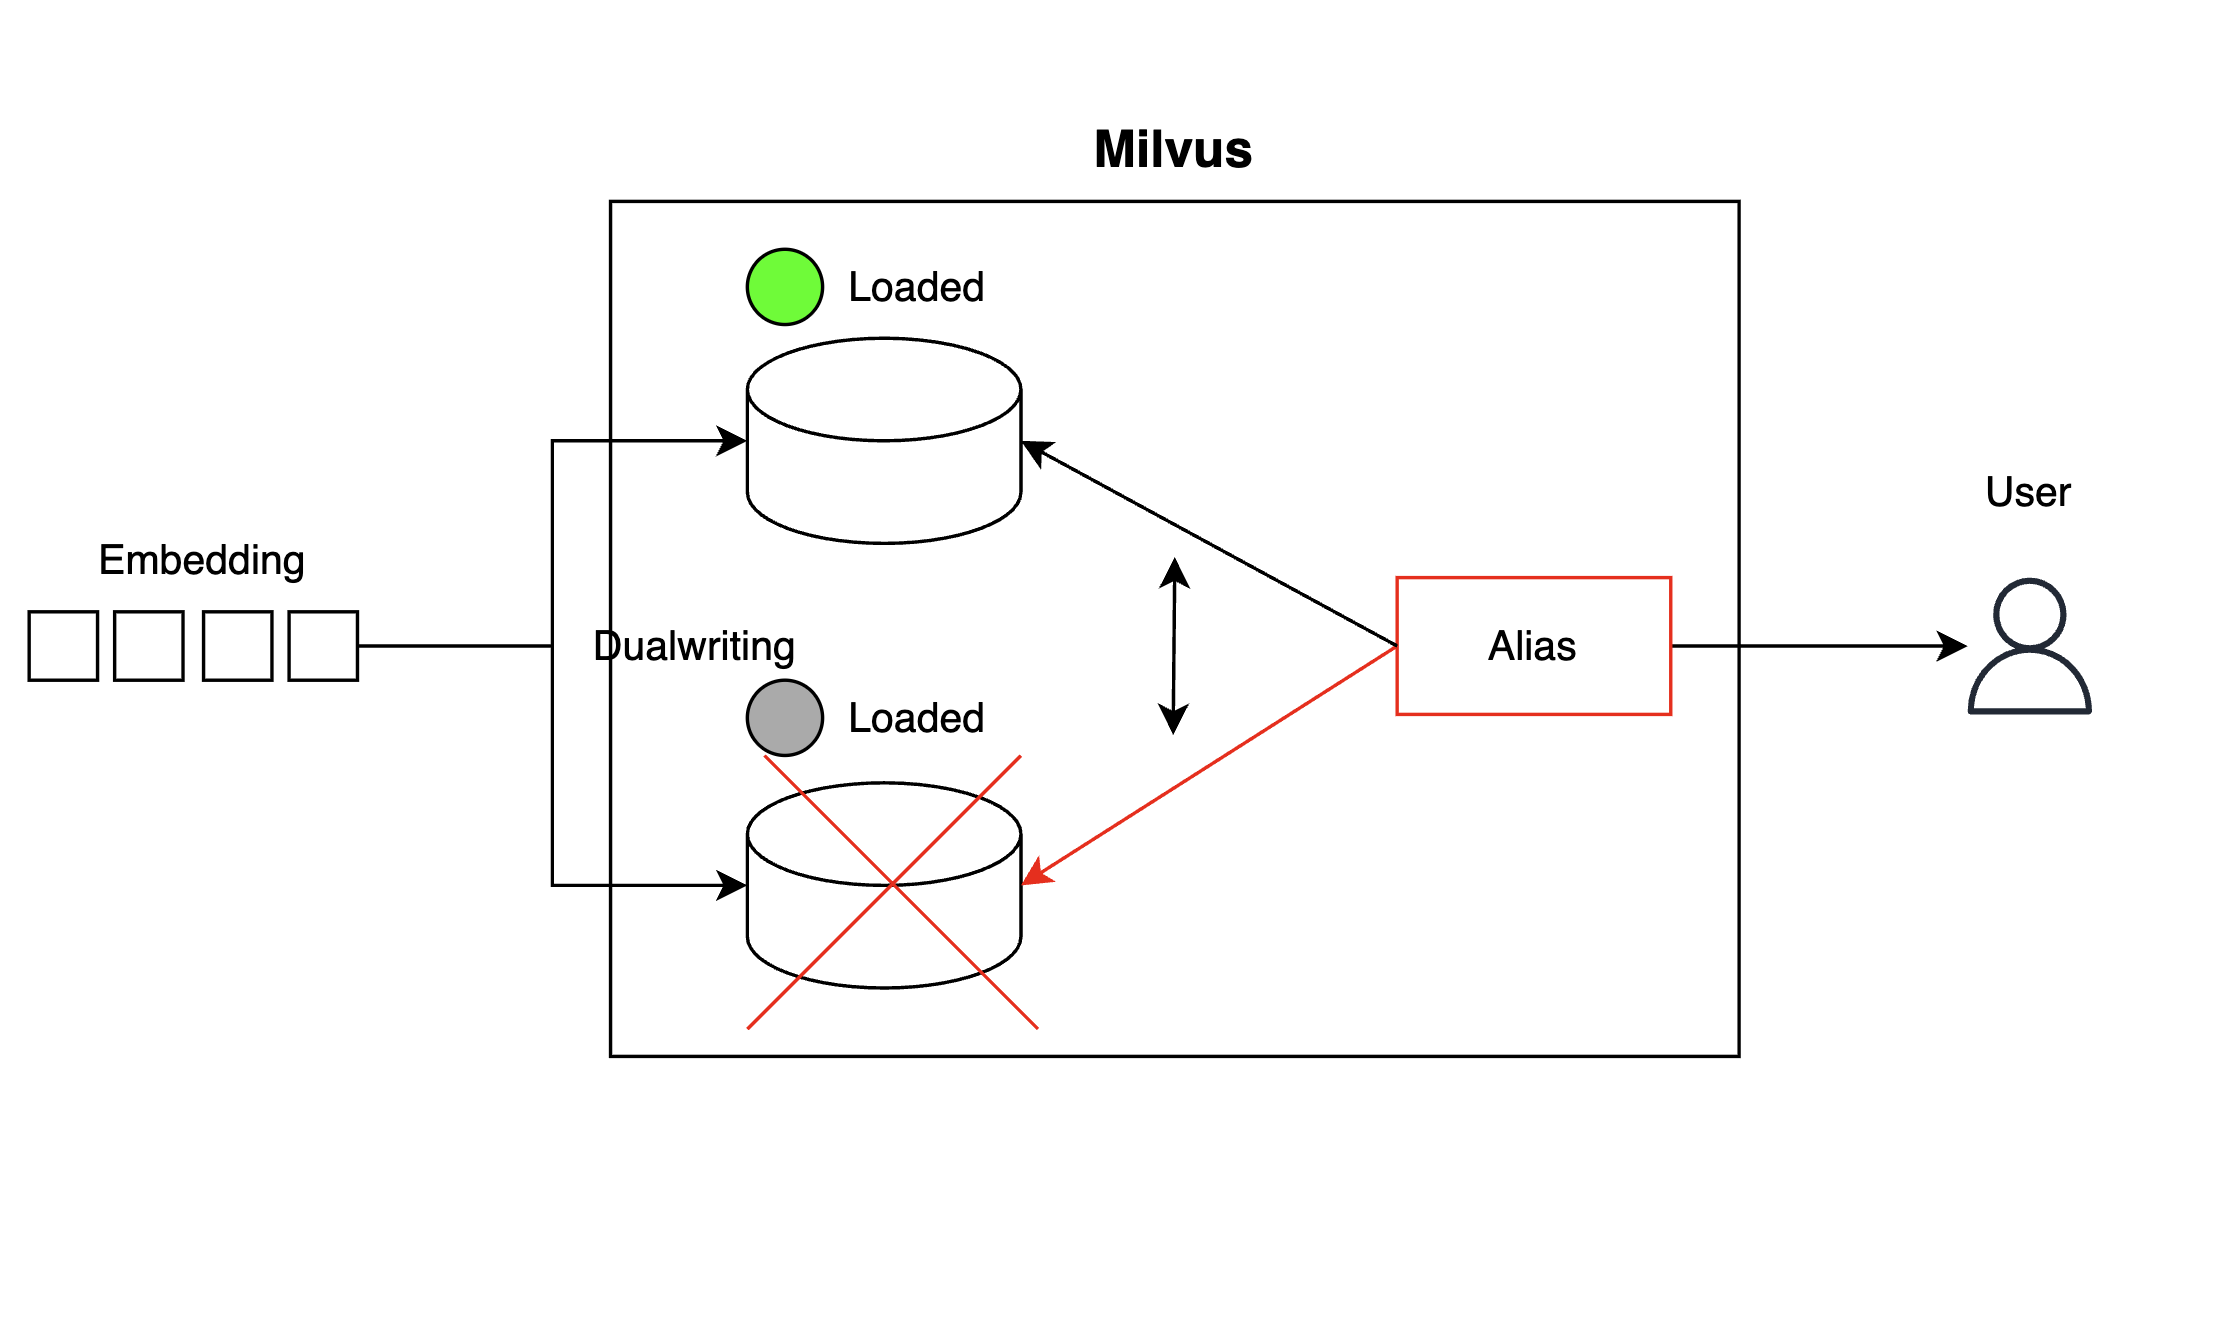
With this setup, if one collection becomes unavailable, aliases can switch references at runtime to minimize shutdown time for backups.
client.create_alias(collection_name="collection_1", alias="Alias")
client.alter_alias(collection_name="collection_2", alias="Alias")
High availability of the coordinator configuration
In Milvus, coordinators control worker nodes, so theyre single pod setups. If a pod fails, it can immediately cause a failure. By setting coordinators in active-standby mode like below, we prevented a single point of failure.
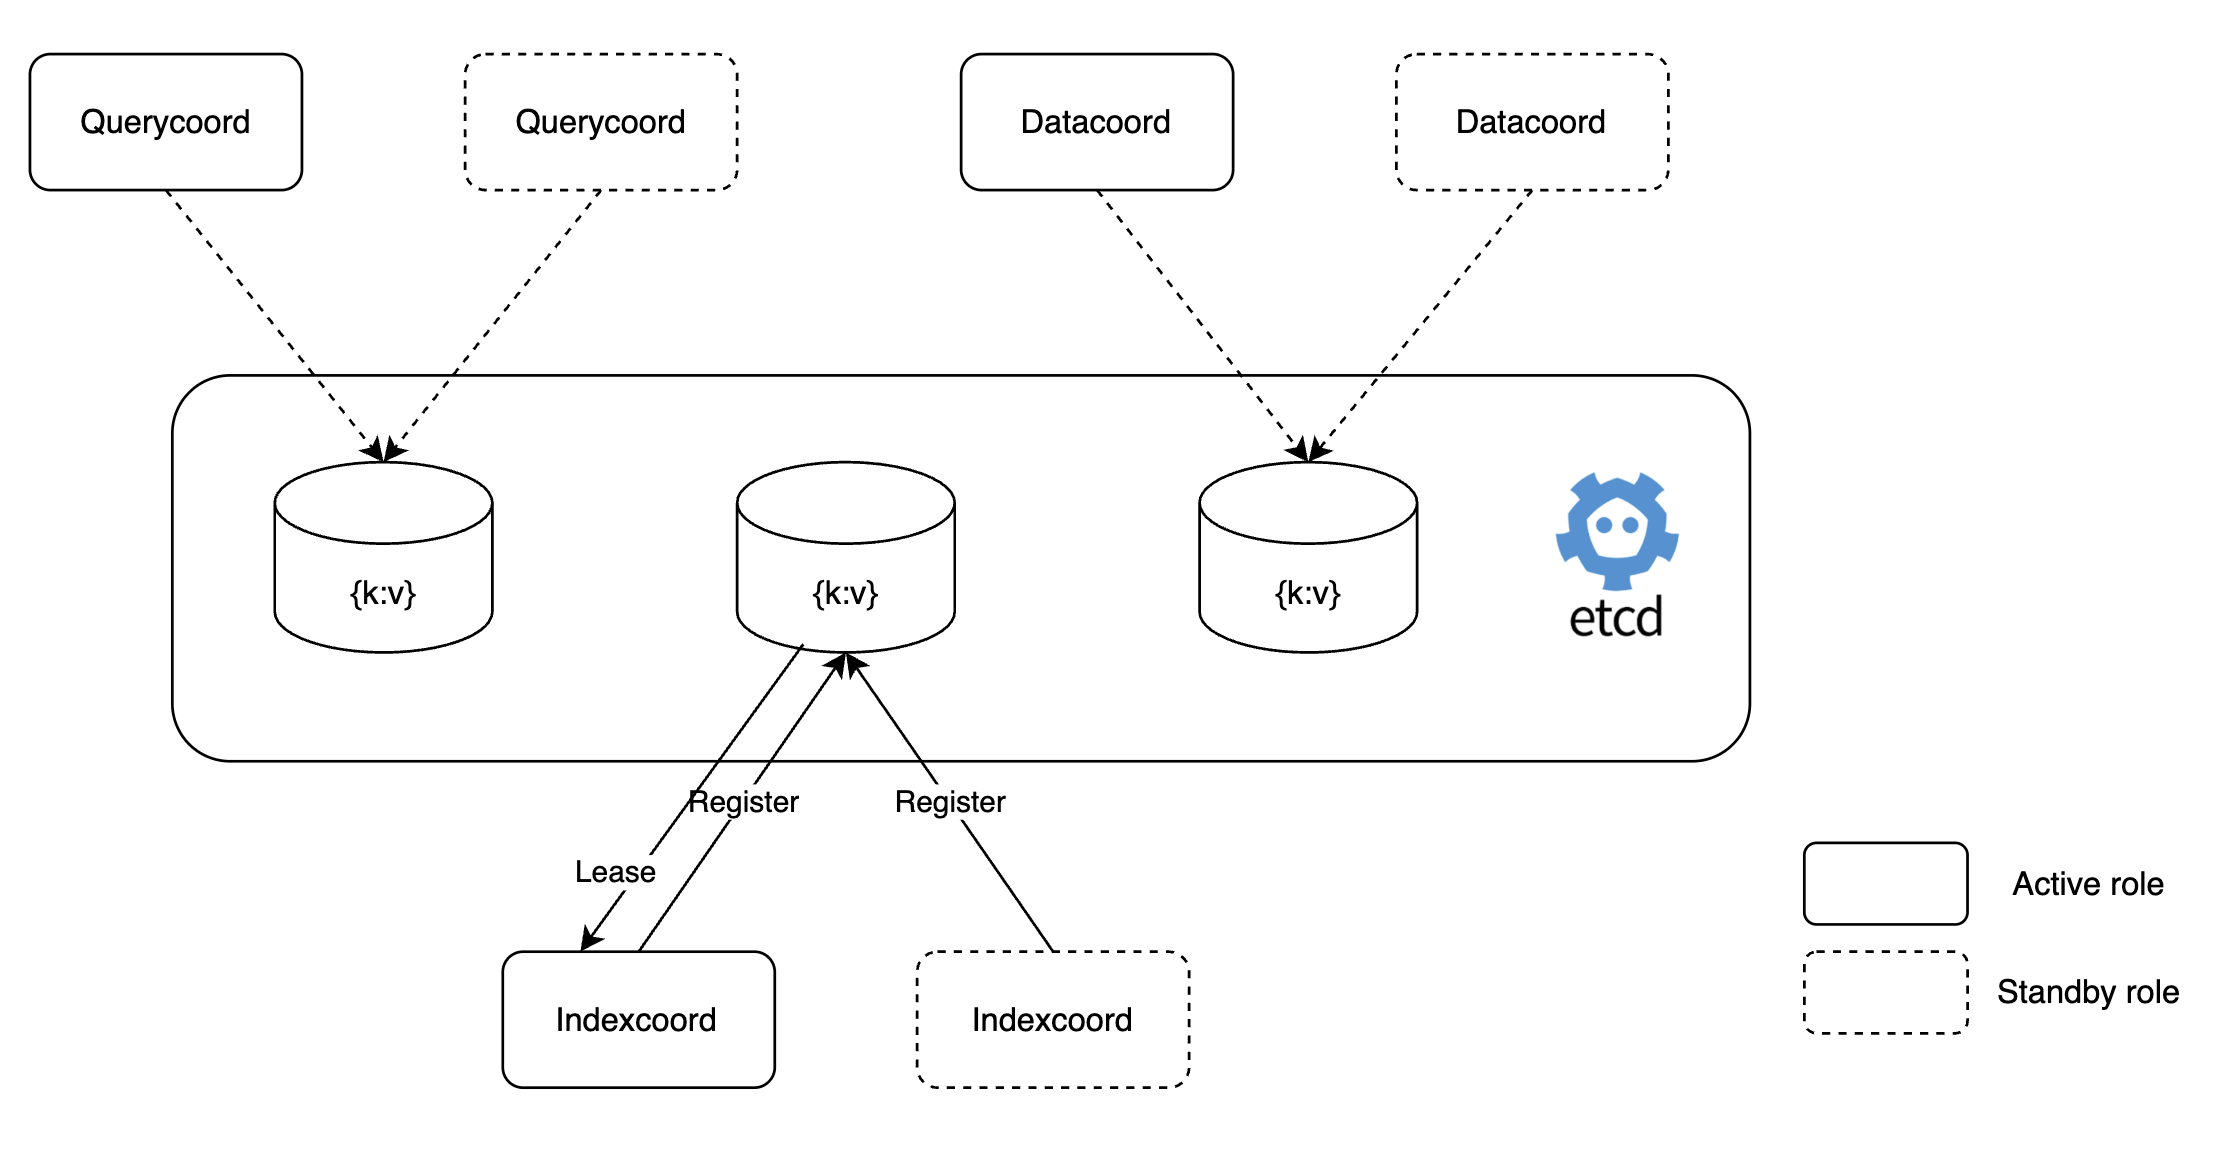
This configuration allows standby index coordinators to work immediately if the active index coordinator stops, avoiding indexing failure. Below is an example of this setting, along with standby dataCoordinator logs showing it working in standby mode.
# value.yaml

dataCoordinator:
  enabled: true
  # You can set the number of replicas greater than 1 only if you also need to set activeStandby.enabled to true.
  replicas: 2  # Otherwise, remove this configuration item.
  resources: {}
  nodeSelector: {}
  affinity: {}
  tolerations: []
  extraEnv: []
  heaptrack:
    enabled: false
  profiling:
    enabled: false  # Enable live profiling
  activeStandby:
    enabled: true  # Set this to true to have RootCoordinators work in active-standby mode.
[INFO] [sessionutil/session_util.go:933] ["serverName: datacoord is in STANDBY ..."]
[INFO] [sessionutil/session_util.go:933] ["serverName: datacoord is in STANDBY ..."]
[INFO] [sessionutil/session_util.go:933] ["serverName: datacoord is in STANDBY ..."]
[INFO] [sessionutil/session_util.go:933] ["serverName: datacoord is in STANDBY ..."]
[INFO] [sessionutil/session_util.go:933] ["serverName: datacoord is in STANDBY ..."]Backup system configuration
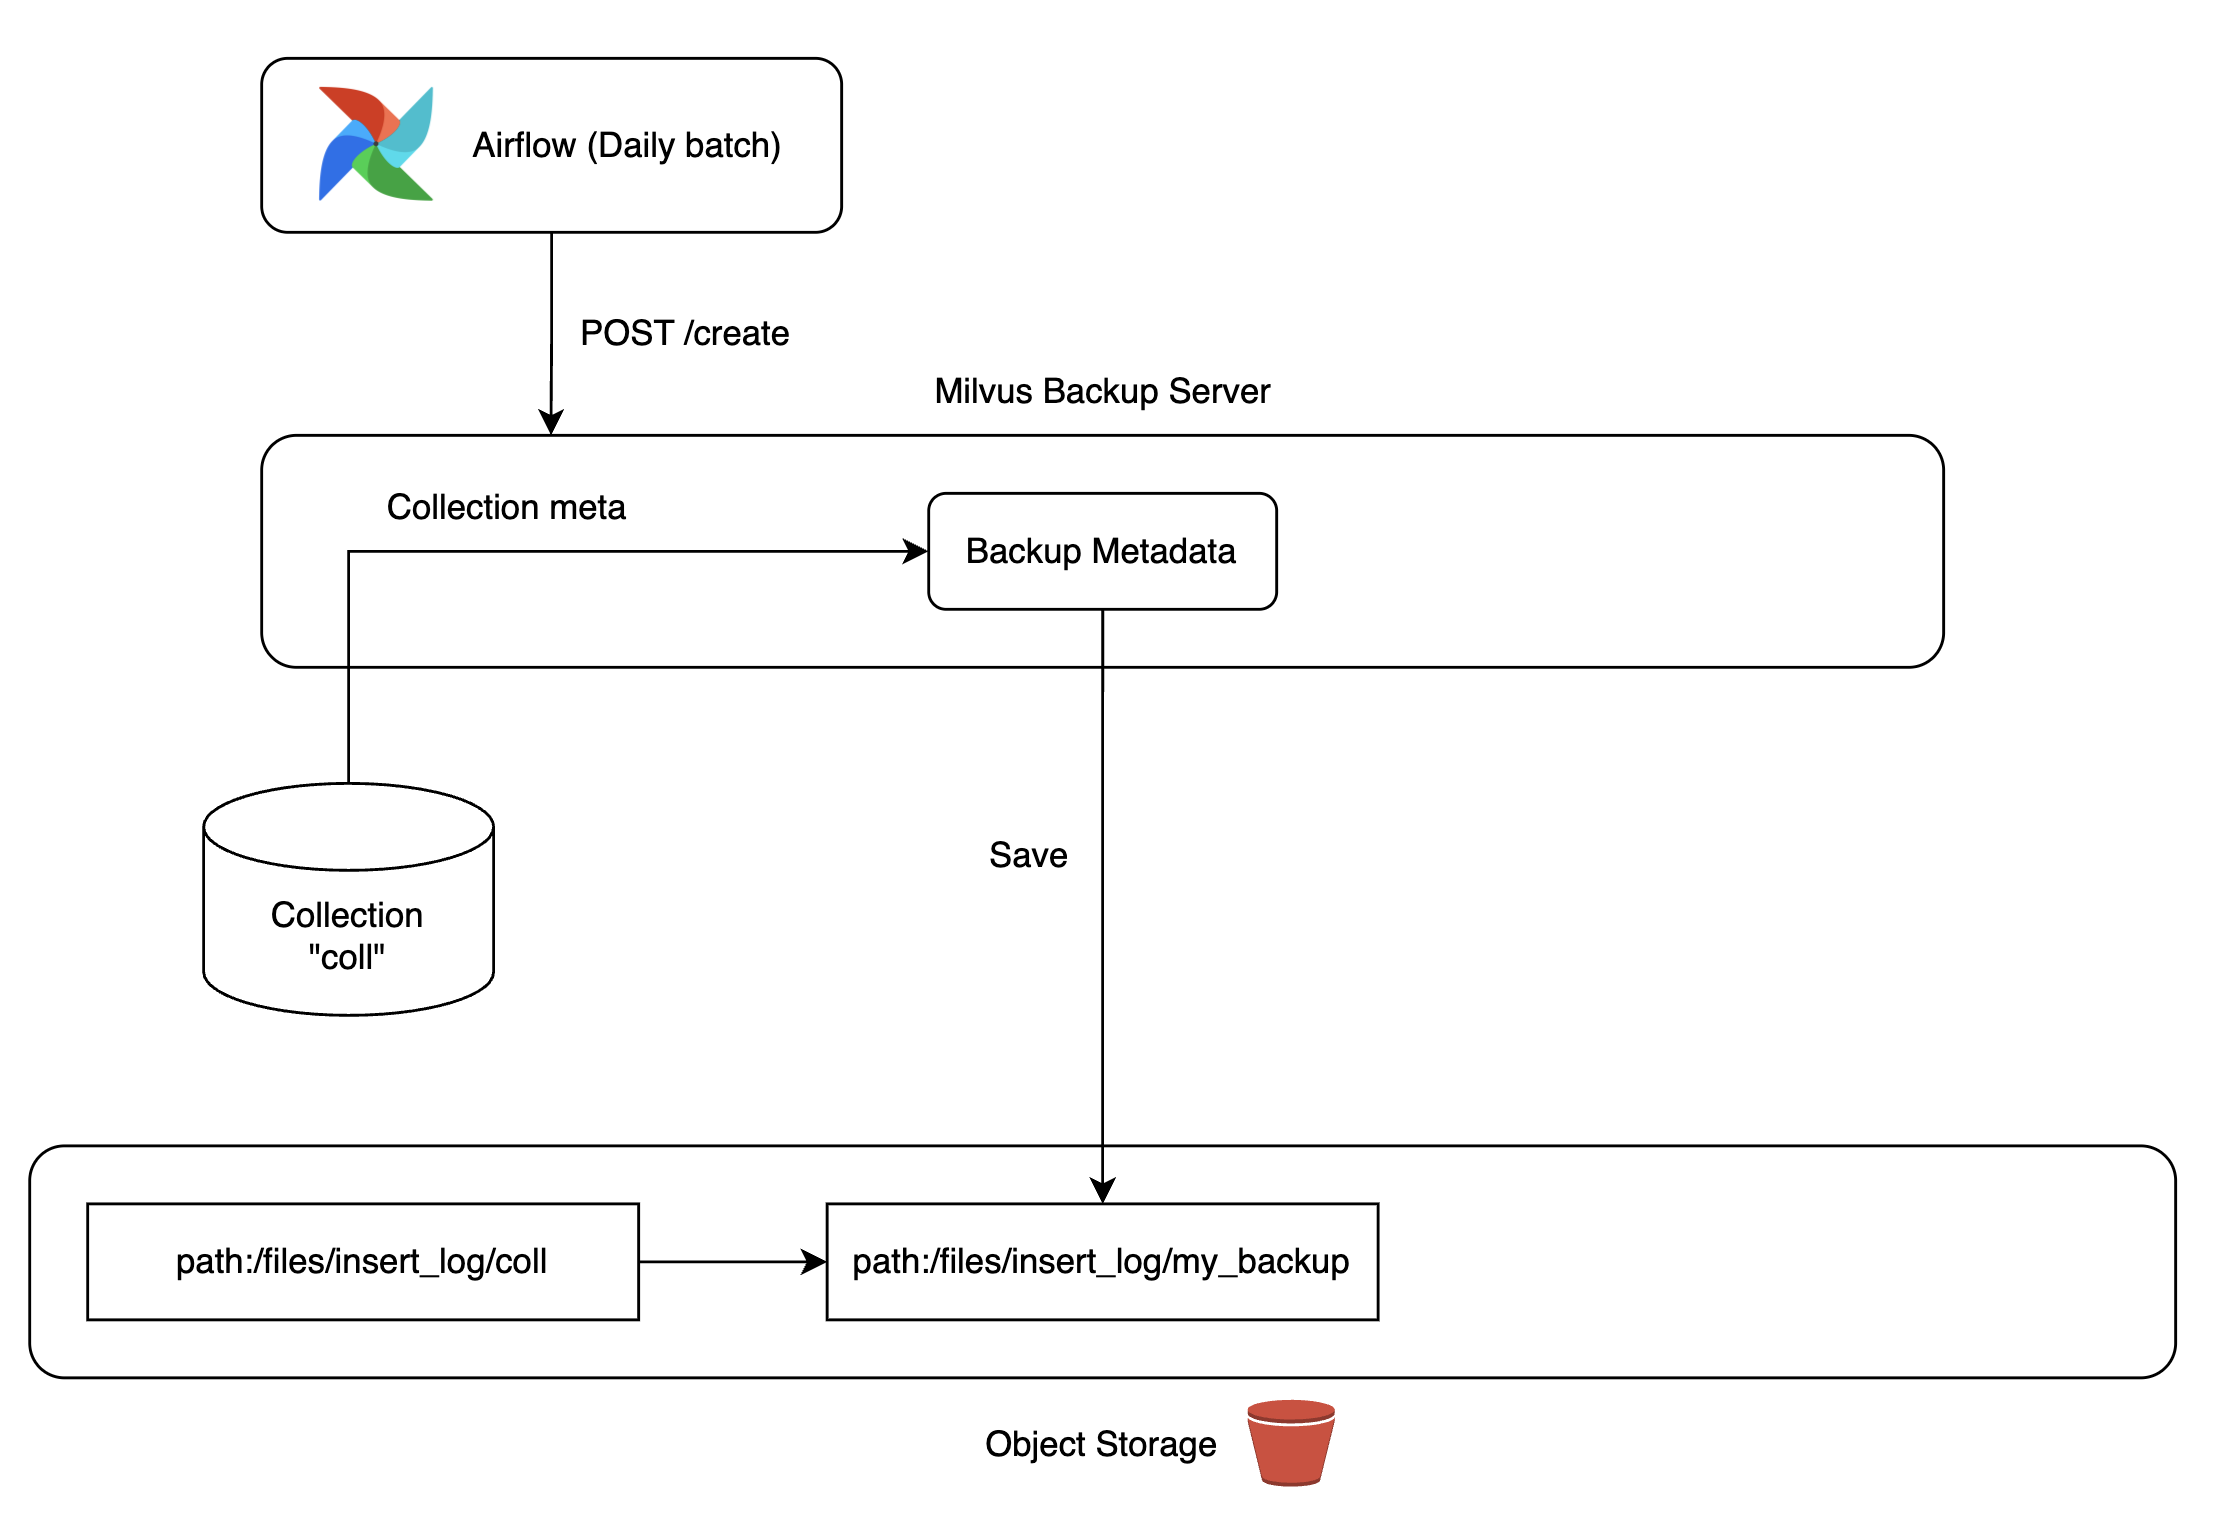
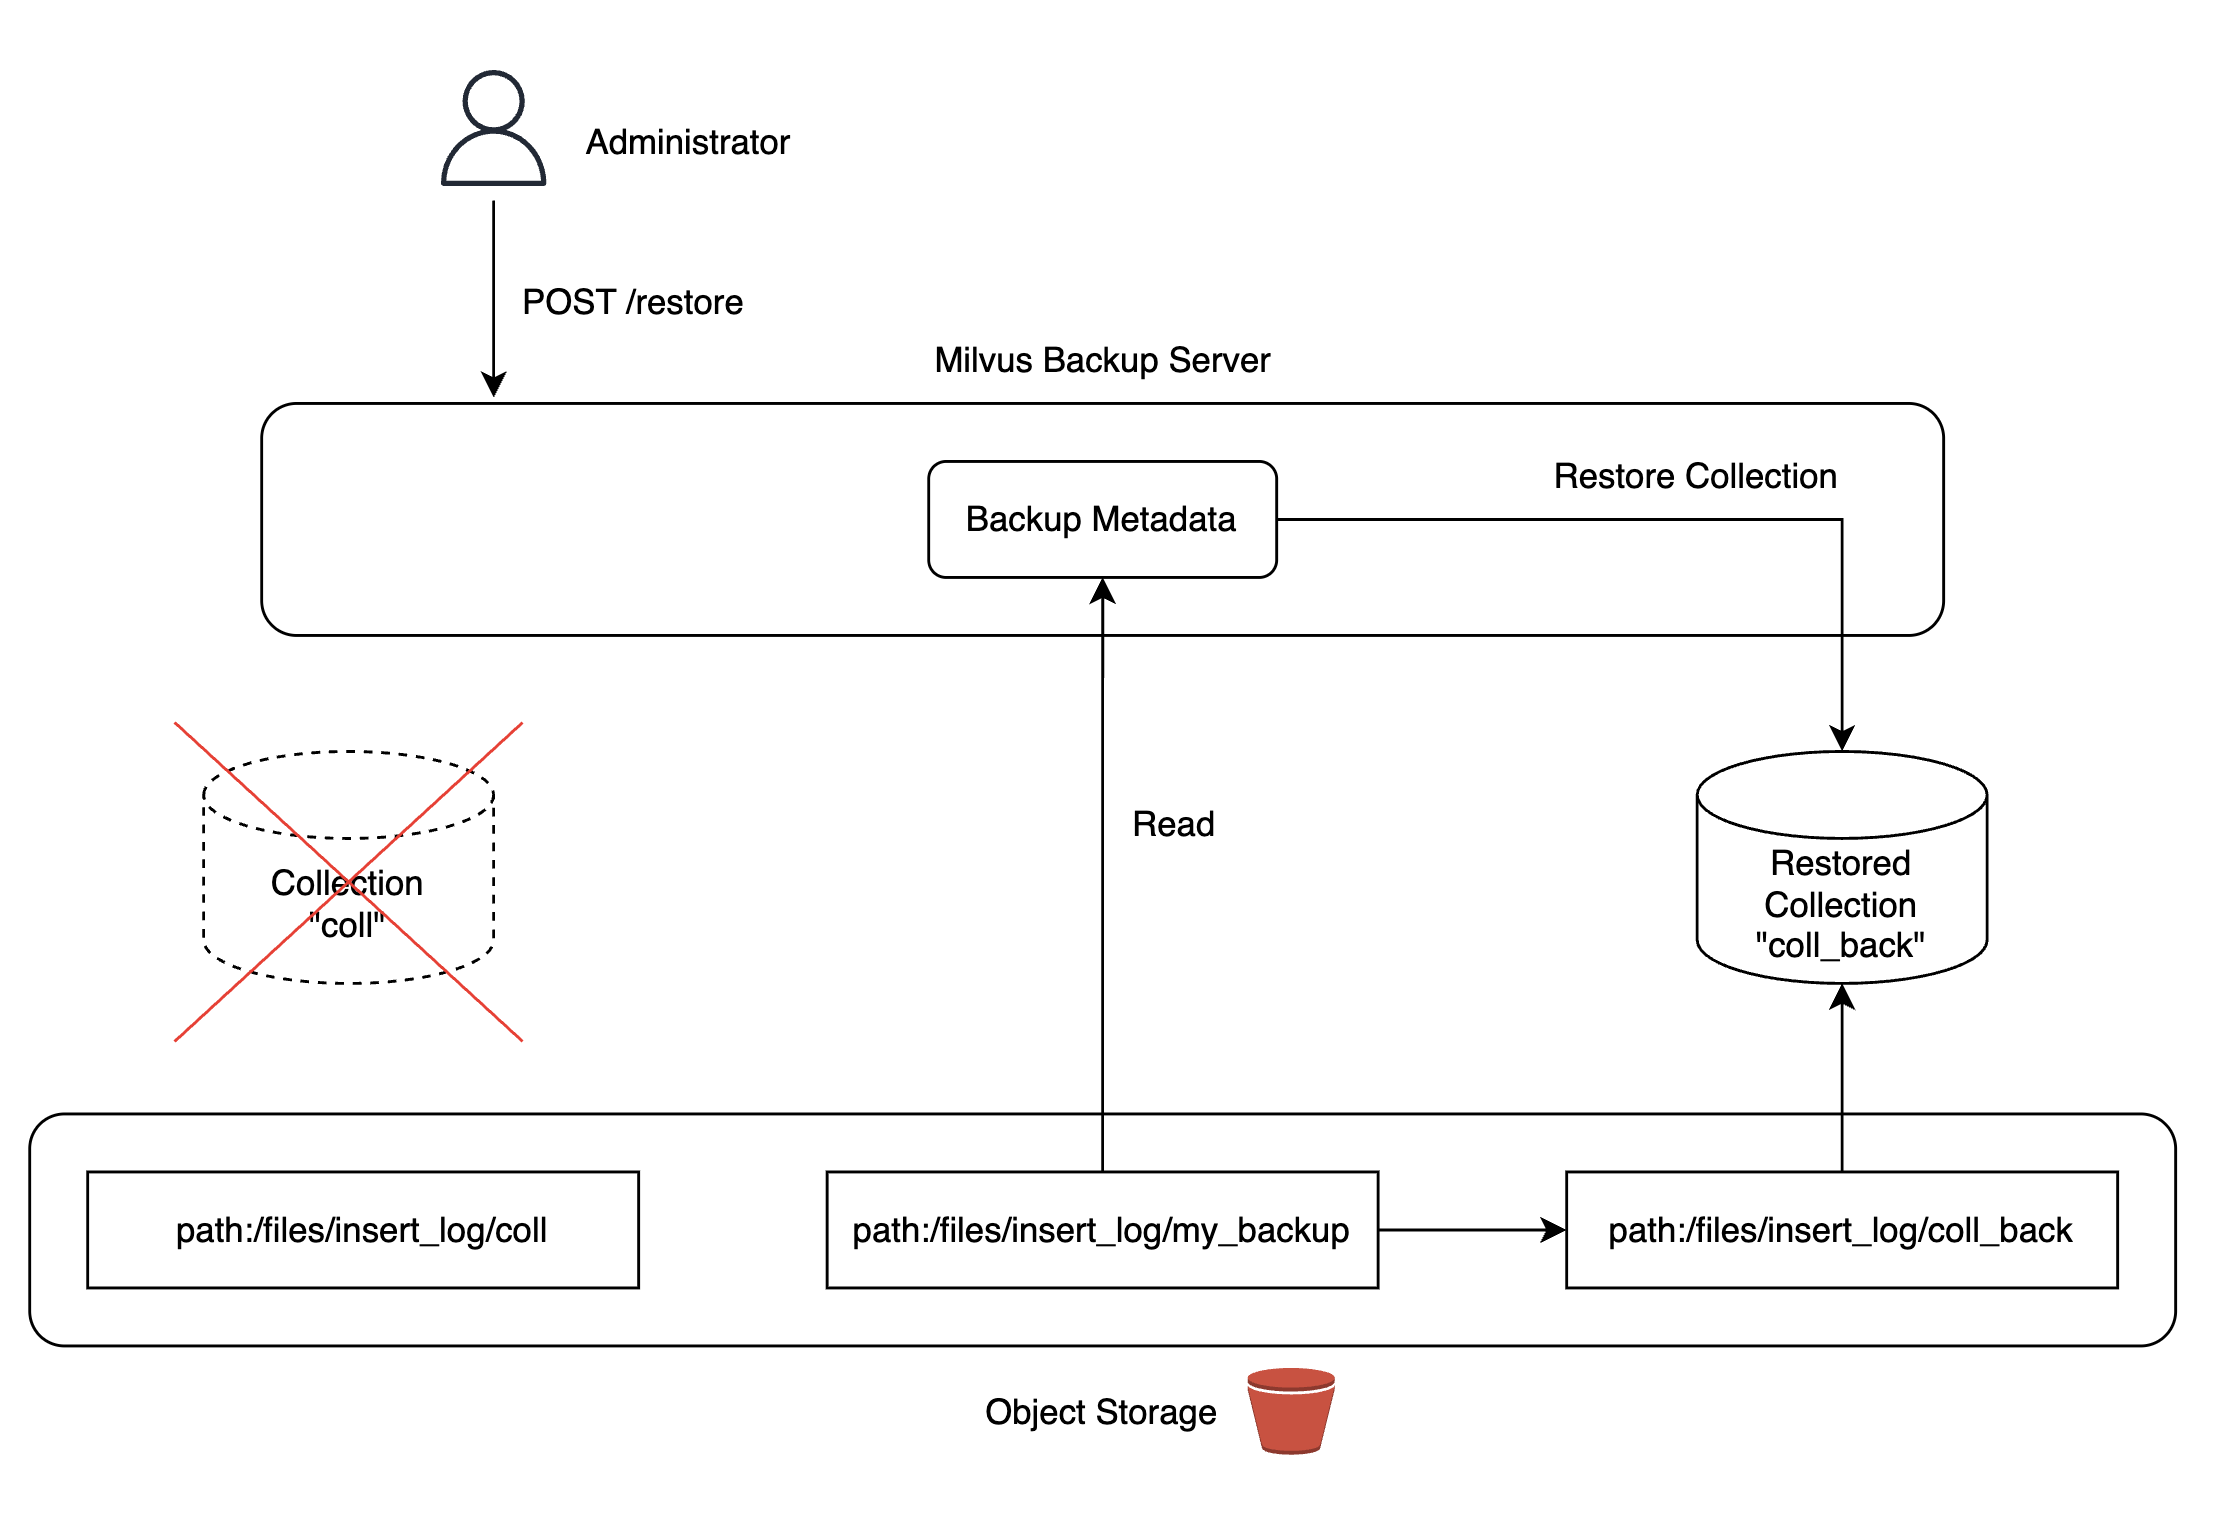
If more than half of etcd stops in a "Kill Etcd (more than half)" scenario, the entire Milvus cluster goes down, with collection metadata loss as a potential issue, leading to critical service failures.
To solve this, we utilized Milvus backup tools to build backup servers. We deployed MinIO in our Kubernetes cluster, replicating data to MinIO storage for easy collection recovery anytime needed.
Backup copies were updated daily via Airflow DAG, ensuring the latest data use if a recovery situation arose. During Milvus backup server configurations, we found and corrected bugs, contributing to the Milvus project (reference).
 |
|
 |
|
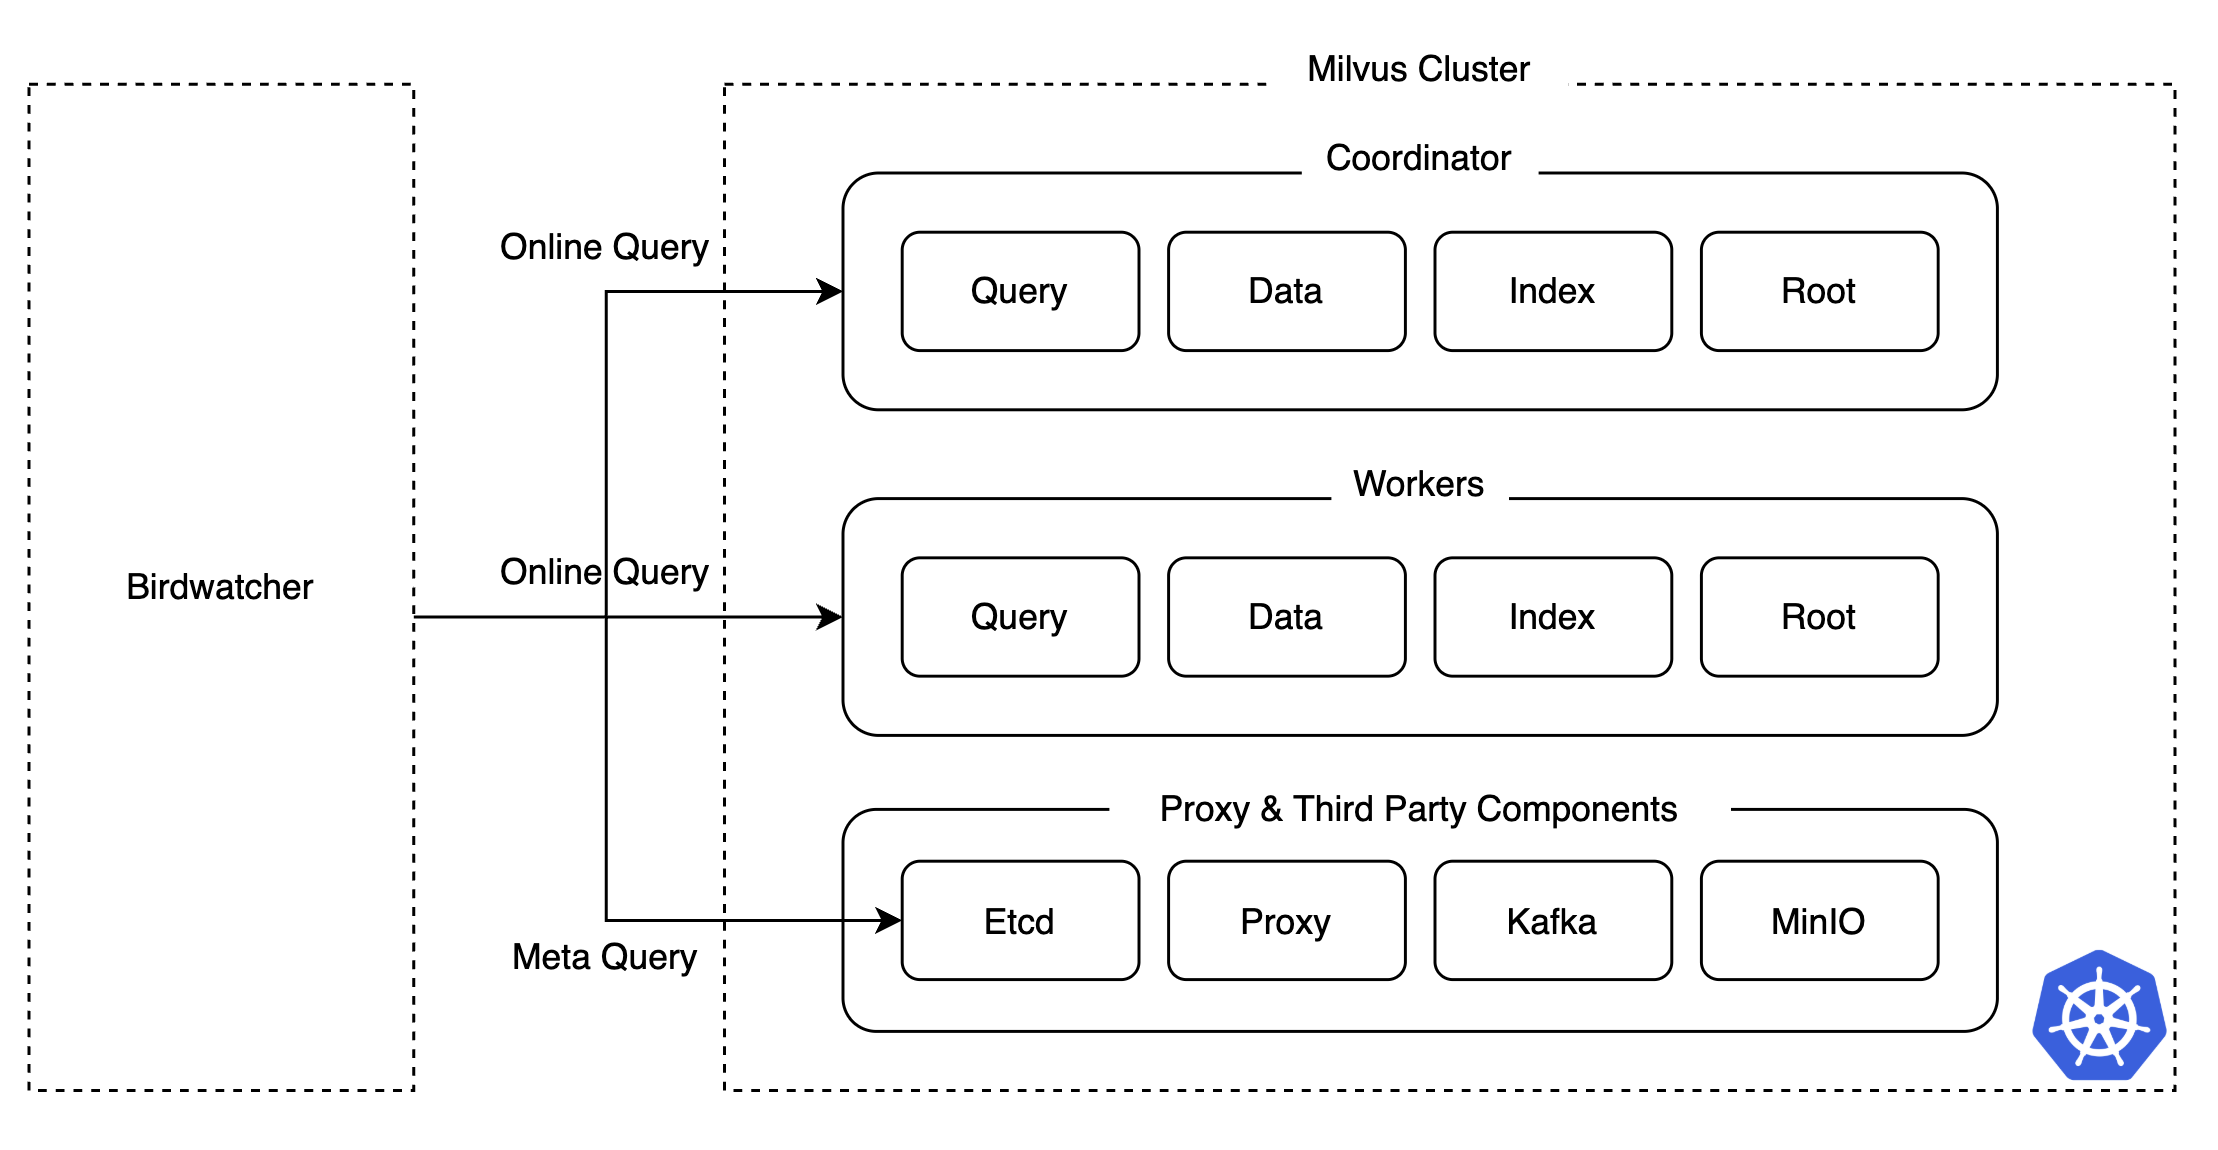
Introduction of Milvuss debugging tool, Birdwatcher
During chaos testing, determining which components were malfunctioning when the Milvus cluster wasnt working properly wasnt easy. Especially in distributed systems, checking logs from multiple components and pods takes considerable time for troubleshooting and recovery.
To solve this and reduce response time to issues, we utilized Milvuss debugging tool, Birdwatcher. It connects directly with etcd to retrieve each components state or metadata easily, simplifying operations.
Chaos test results summary
Chaos tests played a crucial role in proactively identifying and addressing potential issues by simulating diverse failure scenarios in the Milvus cluster. HA configurations for coordinators and collections, backup system setup, and Birdwatcher introduction minimized service downtime and allowed rapid issue resolution in incidents encountered over the years.
Milvus verification 2: Performance test
Even with stability ensured, excessive vector search time or resource demands would make services infeasible. Thus, comprehensive performance testing was essential. While vector search algorithms are vigorously researched and benchmark results exist (reference), verifying if those performances were replicable in our settings was crucial. We sought to examine the performances of various algorithms, evaluate resource and node setup impacts, and measure performance outcomes.
Test scenarios
Some tuning elements affecting vector search performance include the following. Based on these, we devised over ten scenarios, measuring latency, throughput (QPS), and recall performance. Here, well focus on performance tests involving index type comparisons and scaling tests.
- Index
- Index type (ANN algorithm)
- Index parameters
- Scalability and availability
- Scale-up
- Scale-out
- In-memory replication
- Search
- Search parameters
- Batch size
- Dataset
- Dimensions
- Number of rows
Comparison of index types (ANN algorithm)
Vector search performance heavily depends on the index type (ANN algorithm). Each type varies in terms of accuracy, latency, and indexing time; choosing the right type for the service scenario is key. Furthermore, depending on the distribution of embedding data, search performance may differ; verifying a specific types suitability is crucial.
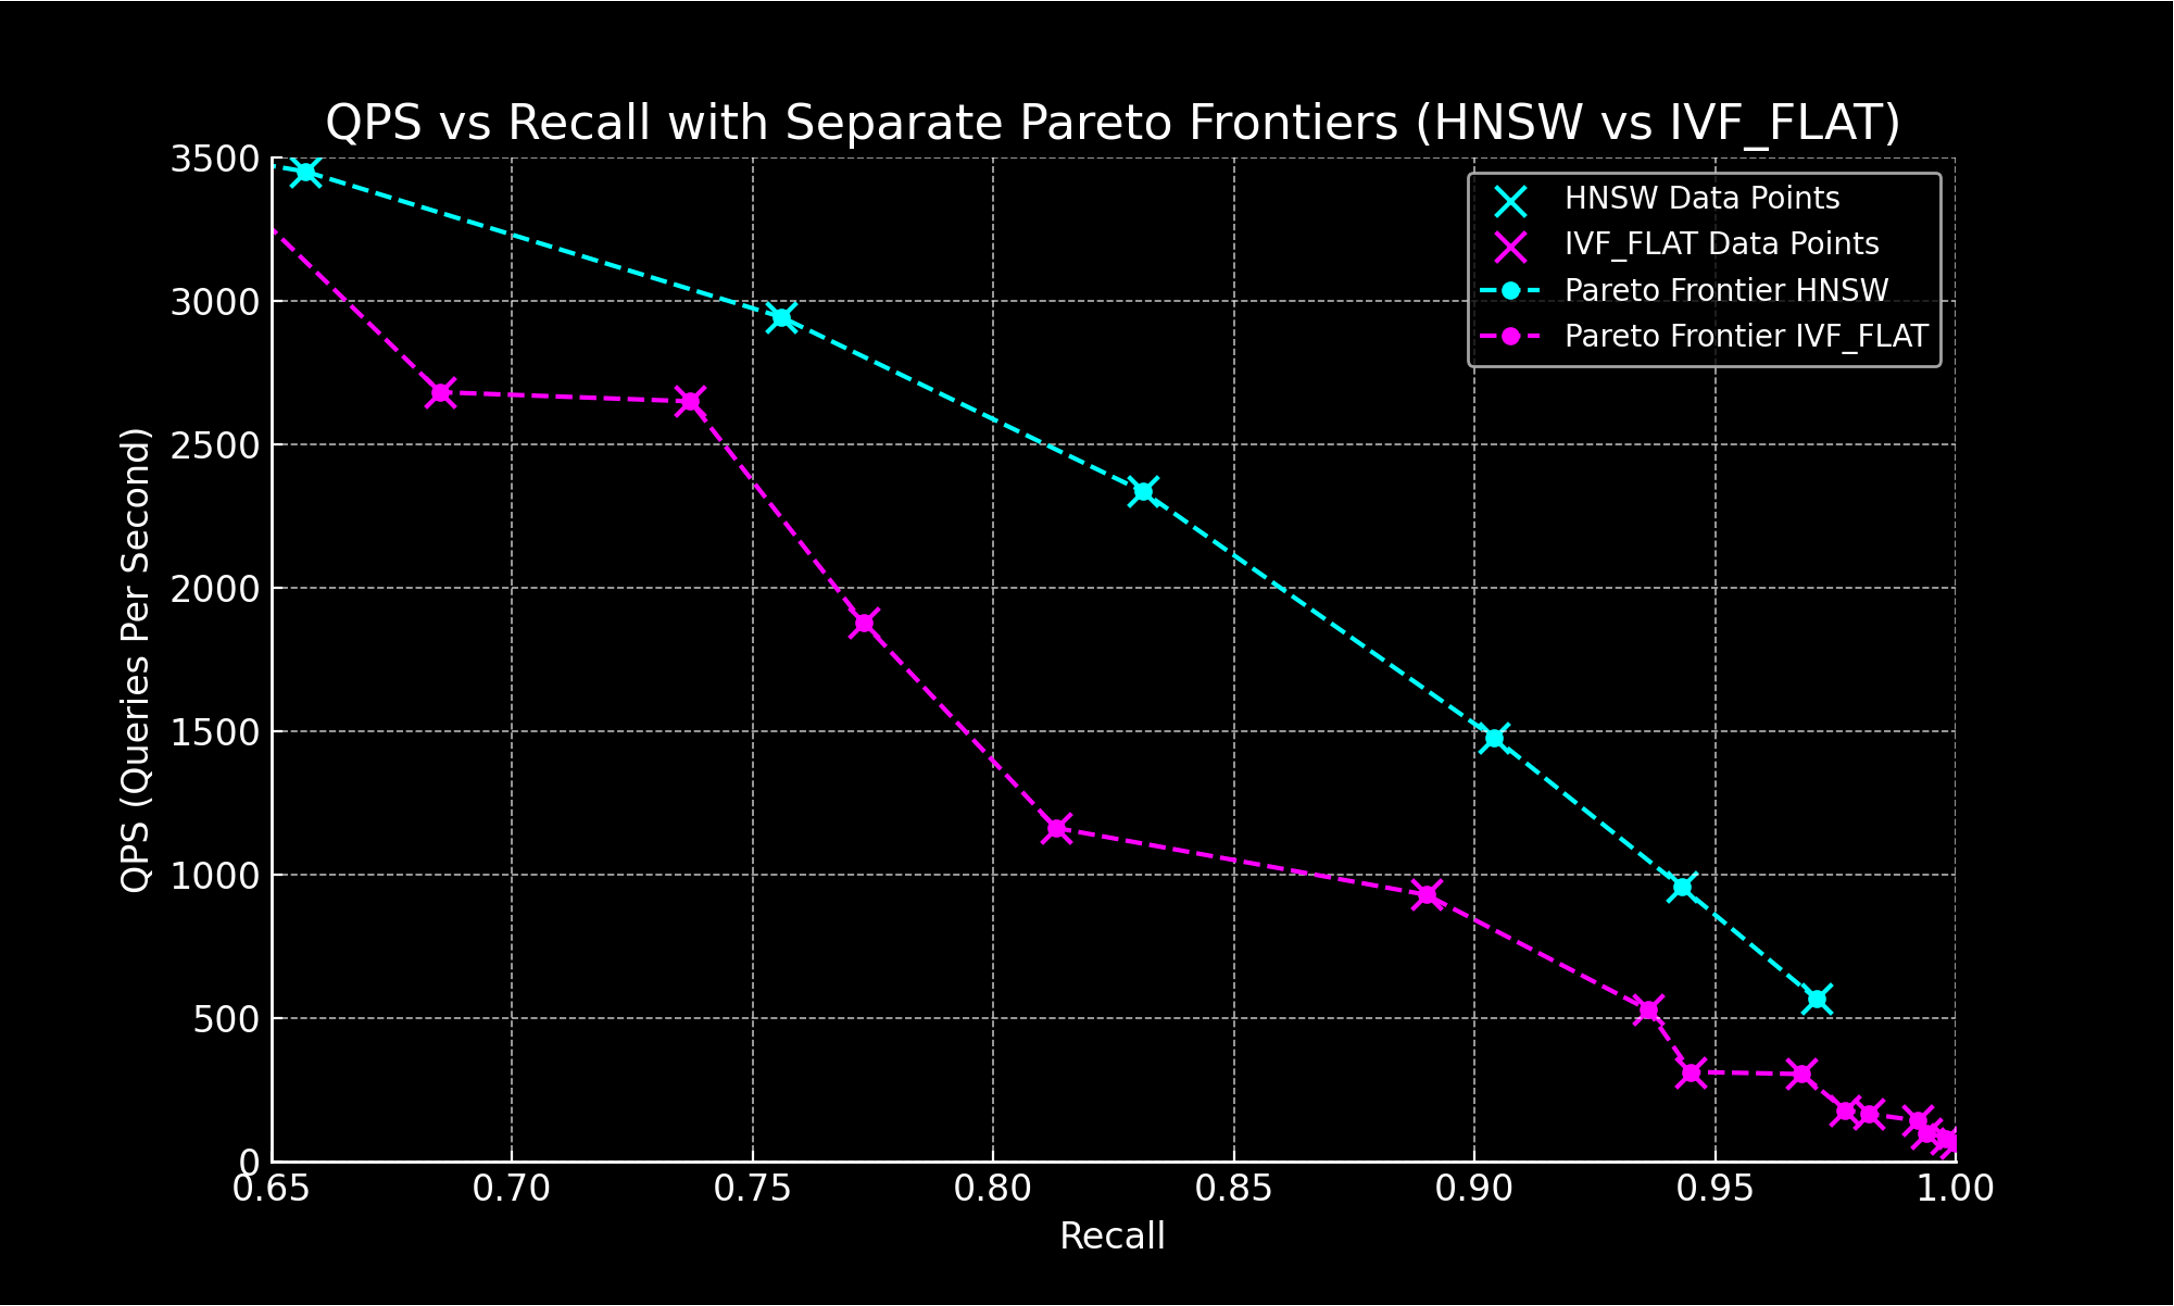
For real-time recommendation systems, latency is paramount. We targeted the HNSW algorithm, known for low latency per documentation, comparing it with IVF_FLAT to verify consistent results in our environment (reference).
| Category | Index name | Accuracy | Latency | Throughput | Index time | Cost |
|---|---|---|---|---|---|---|
| Graph-based | HNSW | High | Low | High | Slow | High |
| Graph-based | DiskANN | High | High | Mid | Very Slow | Low |
| Graph-based | ScaNN | Mid | Mid | High | Mid | Mid |
| Cluster-based | IVF_FLAT | Mid | Mid | Low | Fast | Mid |
| Cluster-based + Quantization-based | IVF + Quantization | Low | Mid | Mid | Mid | Low |
ANN algorithm performance indicators typically include QPS and recall. They are in a trade-off relationship. Adjusting index and search parameters allows performance measurement and comparison of index types.
Comparison result of index types
As a result of comparing index types, the HNSW index displayed higher throughput and accuracy compared to IVF_FLAT and proved equally effective in our environment.
Scale-up and scale-out test
Ensuring scalability through resource expansion is vital when service traffic increases. Scale-up tests determined how many CPU cores to allocate to pods handling queries, while scale-out tests decided replication configurations.
Scale-up test results
The table below summarizes latency, throughput, and failure metrics with increasing CPU cores in query handling pods. Improvements were mostly linear with increases in resource allocation, confirming the ability to leverage multiple CPUs effectively, especially when using eight CPUs markedly boosted throughput.
| CPU | Number of requests | Avg(ms) | Min(ms) | Max(ms) | Median(ms) | TP99(ms) | req/s | failures/s |
|---|---|---|---|---|---|---|---|---|
| 2 | 59,961 | 39 | 3 | 195 | 37 | 97 | 991.57 | 0.00 |
| 4 | 105,183 | 22 | 3 | 118 | 13 | 80 | 1,739.38 | 0.00 |
| 8 | 328,307 | 7 | 2 | 82 | 4 | 49 | 5,427.66 | 0.00 |
| 16 | 511,255 | 4 | 2 | 50 | 3 | 21 | 8,433.64 | 0.00 |
| 32 | 644,904 | 3 | 2 | 67 | 3 | 7 | 10,618.27 | 0.00 |
- Avg (ms): Average latency (ms)
- Min (ms): Minimum latency (ms)
- Median (ms): Median of latency (ms)
- TP99 (ms): 99th percentile latency (ms)
- req/s: Requests per second
- failures/s: Failures per second
Scale-out test results
Scale-out tests confirmed proportionate latency reductions and throughput improvements with increased pod replication.
| Replication count | Number of requests | Avg (ms) | Min (ms) | Max (ms) | Median (ms) | TP99 (ms) | req/s | failures/s |
|---|---|---|---|---|---|---|---|---|
| 1 | 106016 | 22 | 2 | 103 | 12 | 81 | 1752.74 | 0.00 |
| 2 | 199456 | 11 | 2 | 262 | 7 | 64 | 3297.60 | 0.00 |
| 4 | 361358 | 6 | 2 | 96 | 4 | 36 | 5958.22 | 0.00 |
| 8 | 578149 | 3 | 2 | 207 | 3 | 10 | 9555.55 | 0.00 |
In-memory replication test
In Milvus, one way to increase throughput is to increase in-memory replications. By storing data replicas in memory, memory usage increases, but when a node is busy or cant handle requests, other nodes can, enhancing availability and scalability.
In-memory replication test results
Results showed increasing throughput and decreasing average latency with more in-memory replications. TP99 latency also significantly reduced, indicating enhanced similarity search stability with higher in-memory replication.
| In-memory replication count | Number of requests | Avg (ms) | Min (ms) | Max (ms) | Median (ms) | TP99 (ms) | req/s | failures/s |
|---|---|---|---|---|---|---|---|---|
| 1 | 199,806 | 11.81 | 2.64 | 92.69 | 10.51 | 44.80 | 3,303.02 | 0.00 |
| 2 | 356,680 | 6.54 | 2.42 | 92.33 | 5.44 | 31.95 | 5,888.30 | 0.00 |
| 4 | 483,543 | 4.77 | 2.37 | 63.77 | 4.48 | 11.52 | 7,995.04 | 0.00 |
| 8 | 582,954 | 3.93 | 2.16 | 160.38 | 3.60 | 10.03 | 9,636.69 | 0.00 |
Performance test results summary
Performance tests showed how vector search throughput and latency varied according to index types, CPU allocations, pod replication extent, and in-memory replications. HNSW index showed its low-latency and high-throughput strengths held true in our setup. Greater CPU cores and replication in query-handling pods linearly increased throughput and reduced latency. Furthermore, in-memory replication further improved service robustness and performance.
Results of Milvus application
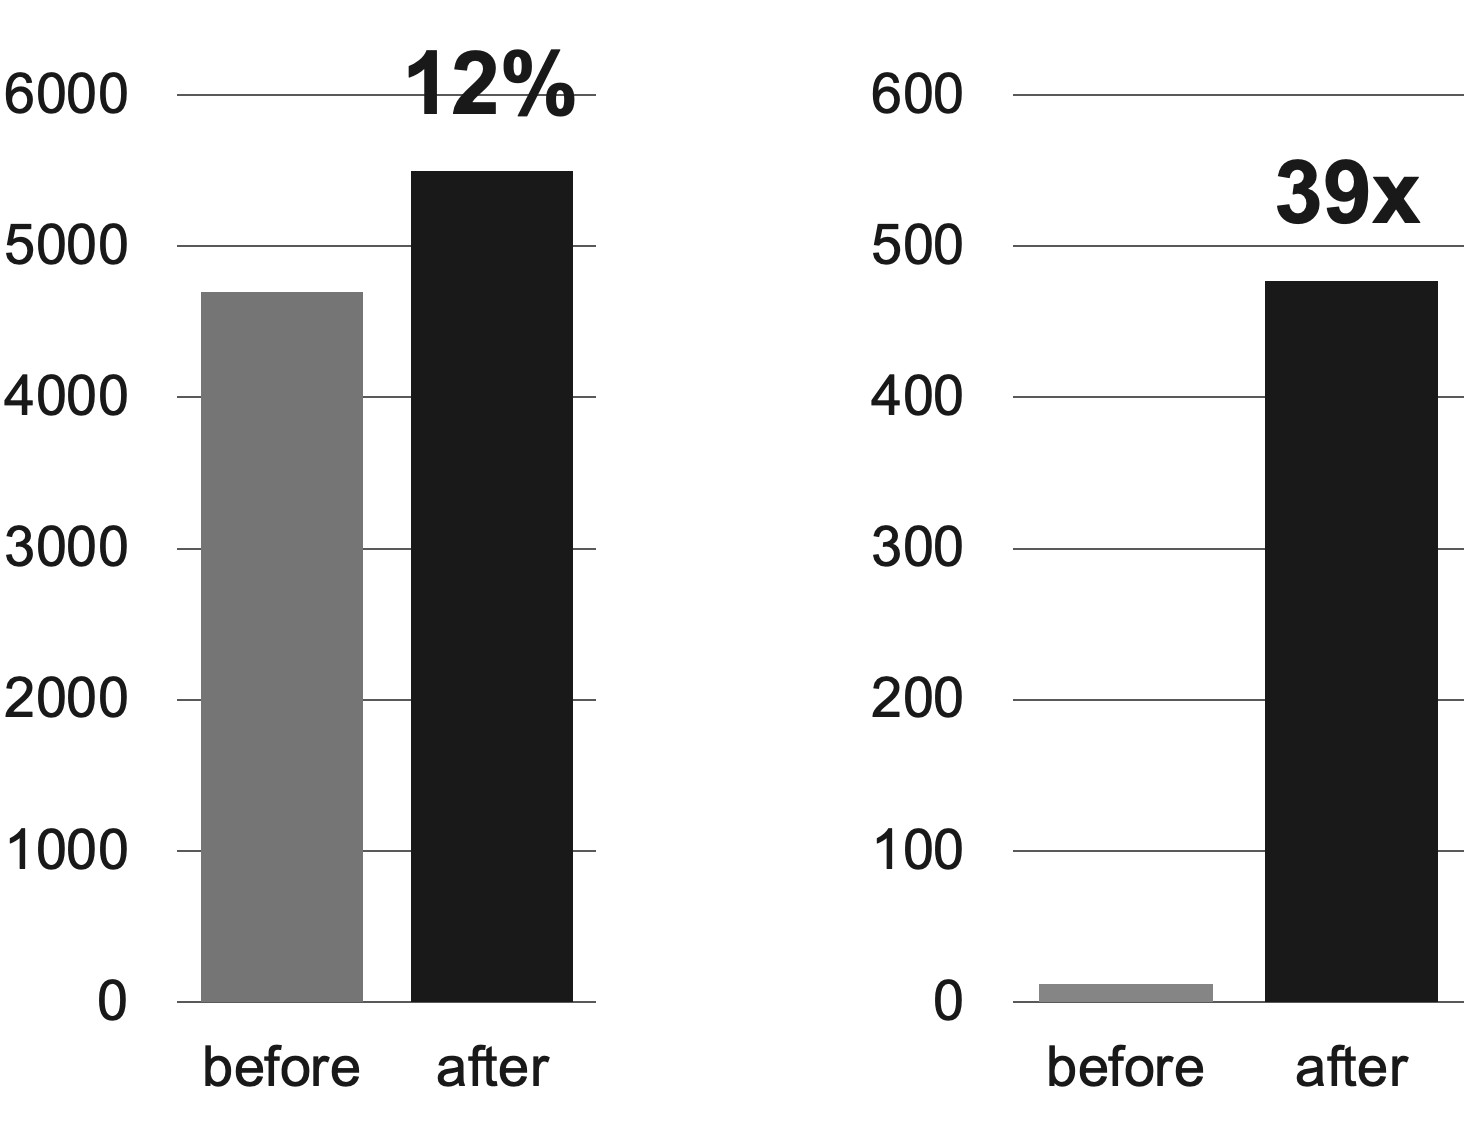
By introducing a Milvus-based real-time recommendation system, we observed improved service immediacy, detailed with two metrics related to service immediacy.
The first graph on the left shows the "Number of posts created and exposed in recommendations within seven days", which improved by 12% compared to before. This indicates the recommendation candidates comprised newer posts than before.
The second graph on the right shows the "Number of posts created and exposed in recommendations on the same day". Before, daily batch updates limited same-day post exposures, but integrating Milvus boosted the figure over 39 times.
Conclusion
In this post, we shared the process and results of implementing the Milvus cluster version, a vector DB, to convert the existing recommendation system into a real-time one. Along the way, we conducted performance and chaos tests to verify and address any issues with our complex system potentially impacting performance and stability. Leveraging insights from these tests, we could implement performance maximization and failure prevention measures, significantly enhancing recommendation system immediacy while maintaining performance and stability, successfully operating for more than two years.
We hope this article helps those seeking to make real-time improvements to recommendation systems. Thank you for reading this lengthy post.