I work in the LINE Official Account (OA) team as an Android developer. One of our jobs is to maintain OA Chat which allows LINE OA followers to have a one-on-one chat with the LINE OA account owner.
Among our tasks, one is to monitor the performance metric such as the Chat Entry Time, the time it takes from opening the Chat room until the content finishes loading. It's acceptable for OA Chat to take a bit longer than non-OA Chat but we'd always like to keep Chat Entry Time to a minimum, even if it's just a few tens of milliseconds.
That means our team needs to watch a critical path of code flow and pay attention to any slightly heavier function calls, which is a trickier job than expected because:
- Our team is looking at "heavier" operations, not some slow functions that show up on the profiling screen on local devices that are more obviously noticeable.
- Tracking all possible operations in the critical path isn't practical
- It's not worth the effort
- There are too many shared logic between us ( OA Chat) and other non-OA Chats
However, every time our team checks the data and understands that something in our code path makes it slower, we want to at least narrow down the scope so we can at least optimize those parts first.
This is actually quite different from a textbook example. In those, there's always one truly bad operation that spends hundreds of milliseconds just to render a few characters. Then the bottleneck is identified and resolved.
In our team's case, we are facing many operations in the critical path, some of them might be a bit slow, some of them might not be relevant and we can only find some suspects and optimize them to see if the performance really improves.
It's more like a routine job where our team figuratively watches a map and sees if there's one vehicle running a bit slower than the rest. If we find it, we revamp that vehicle.
Therefore, our team documents the code flow of the critical path and reviews them together, but to maintain this document is a very, very tedious job.
...wait, tedious?
Recently, something called AI has come into the picture, which is known to never get bored with tedious jobs, why not ask it to do this?
The original requirement and the text version
Given some code that sits on the critical path, our team wants to visualize the code flow, showing the threads (Main or IO) the code is running, and if something is suspicious, highlight it.
The first hand-made representation is like this:
EntryActivity
    +-- onResume()
            +-- requestRefresh()
EntryLogic
    +-- requestRefreshContext()
            +-- initializeViews()
                    +-- bindInfoToController()
ViewController
    +-- setChatInfo()
ListController
    +-- requestInitializeList()
ListAdapter
    +-- requestInitialSearch()
SearchController
    +-- requestInitialSearch()
            +-- executeSearchTaskX()
                    +-- maybePostSearchFinishedEvent()
ViewController
    +-- onSearchRequestFinished()
            +-- performanceTracker::sendEnterLog
(Note: all operations are obfuscated. Not their actual names.)
This is barely helpful at all.
First, it's impossible to see which thread those functions run and, second, it's also very difficult to see what they really do, but this already took us probably a few hours to do because our team needs to manually go through all the code and list them up.
Note that it's not a simple call stack. It's greatly simplified, and some actions are triggered by some other much dedicated (legacy) events.
Let's try and visualize it using some tools.
Visualization using tools
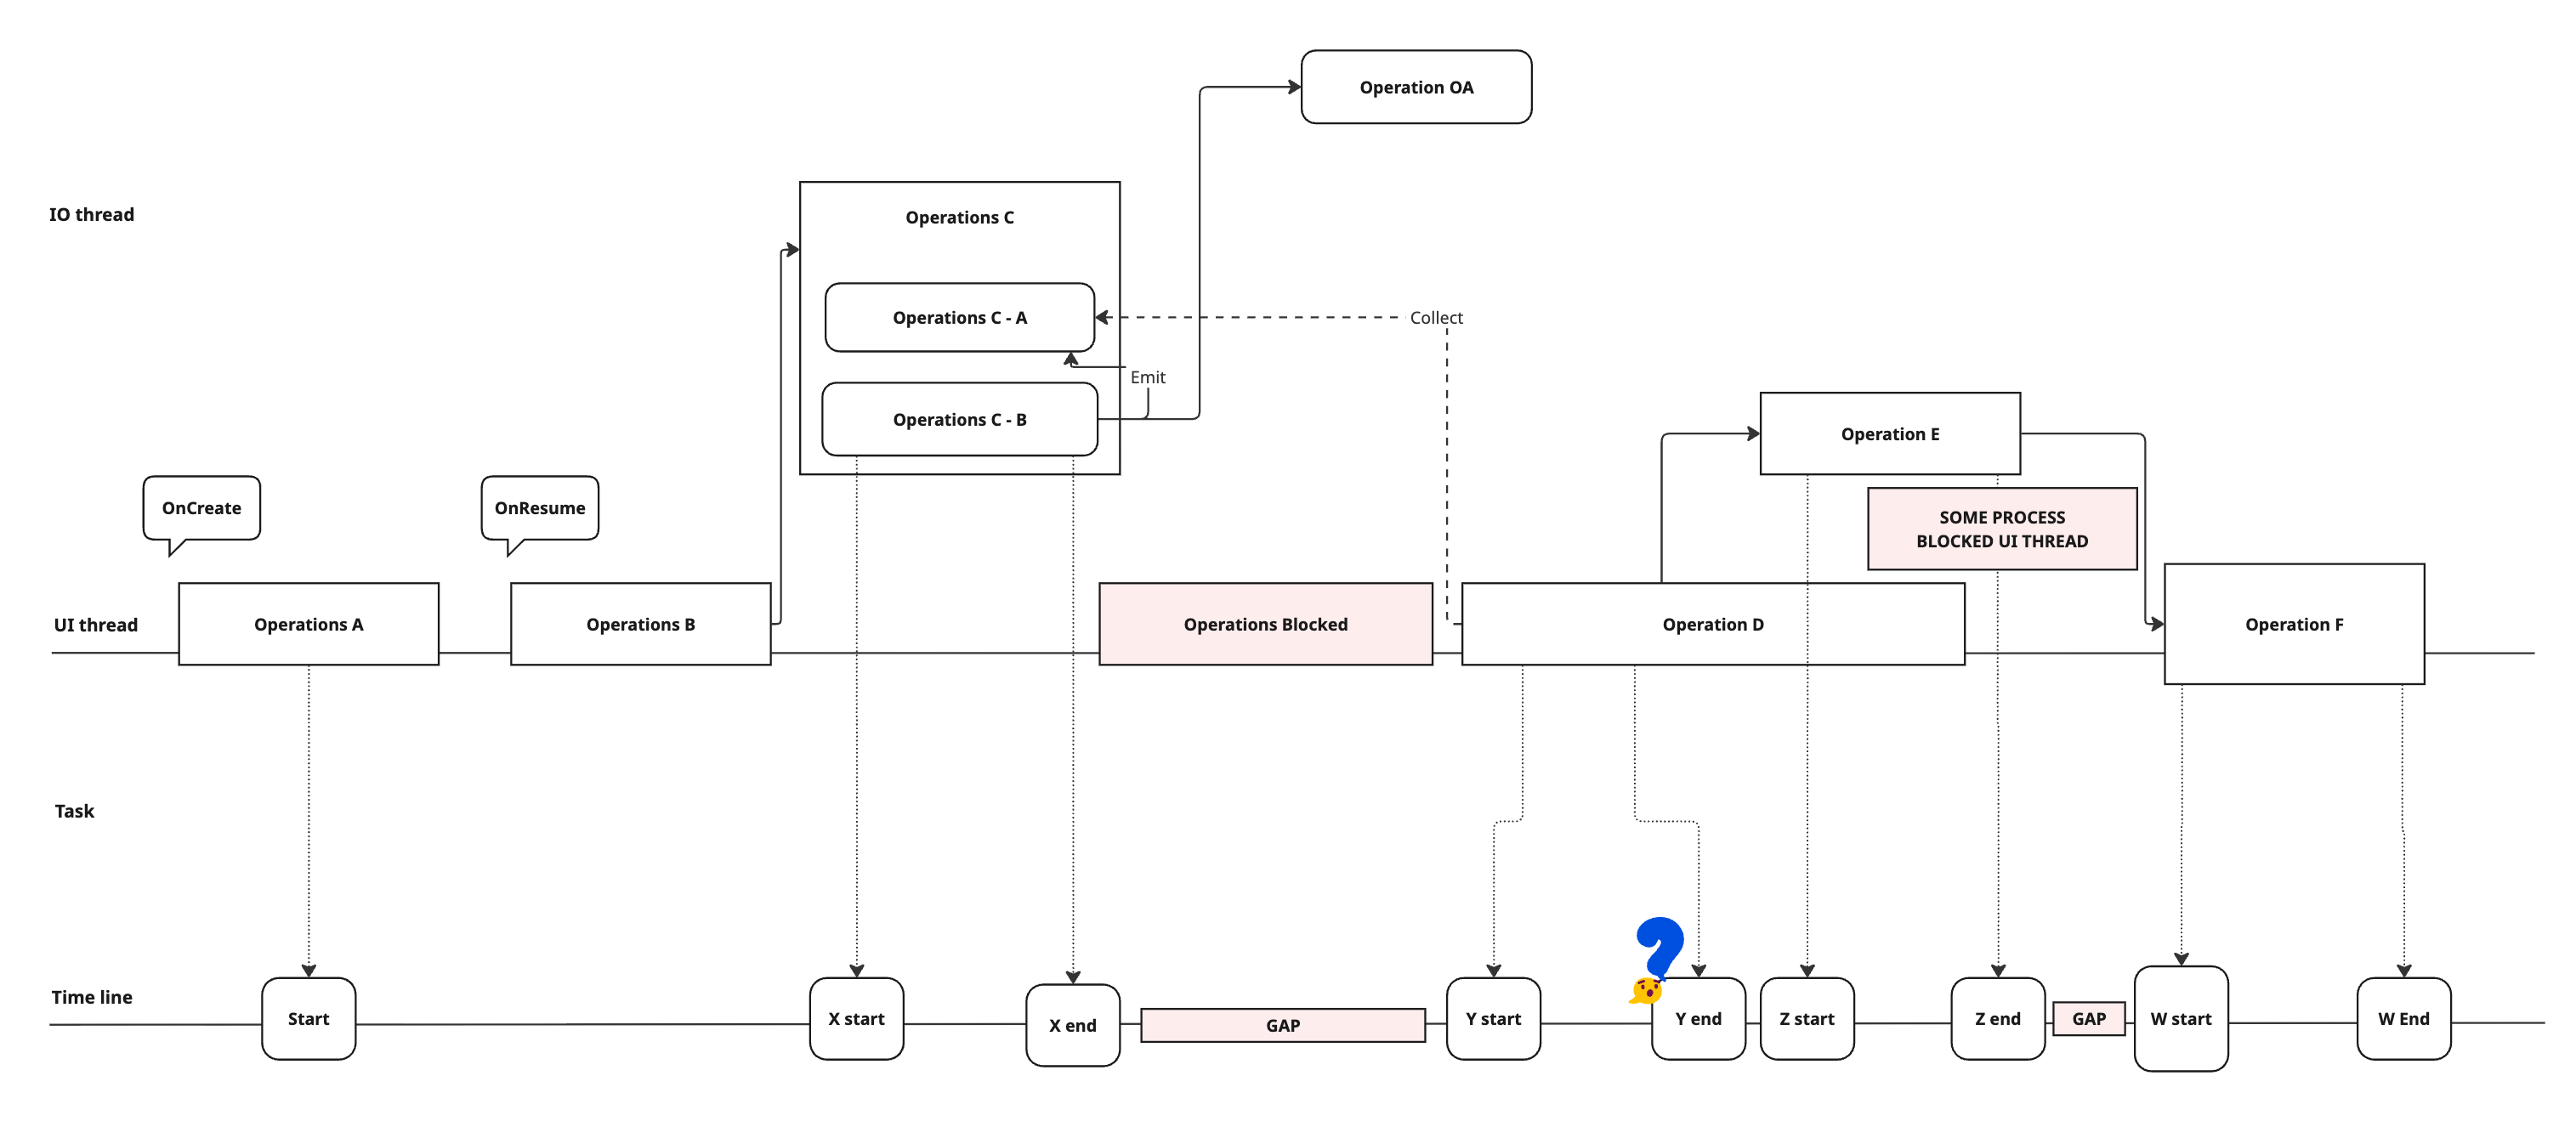
This may look simple but this turned out to be very helpful. It's on Miro so when our team discusses it, we can drag and drop components, move them into a different order so we can see if something is really blocking the critical path or not.
Nevertheless, there are still a few issues. First is that if our team wants to, for example, dig into a component because we think it might've caused the issue, there is no way to expand it right away during a meeting. It's also pretty difficult to link back to the real code.
Besides, it can't update by itself. The actual flow may change during our discussions, maybe after the meeting, or by other pull requests; our team can't perfectly follow these changes all the time.
Used AI to help
Why not try and use AI for this? It seems like the AI is the perfect candidate for this type of work.
Let's point to a part of the code and tell the AI "Please visualize the code flow for me" and wait a bit:
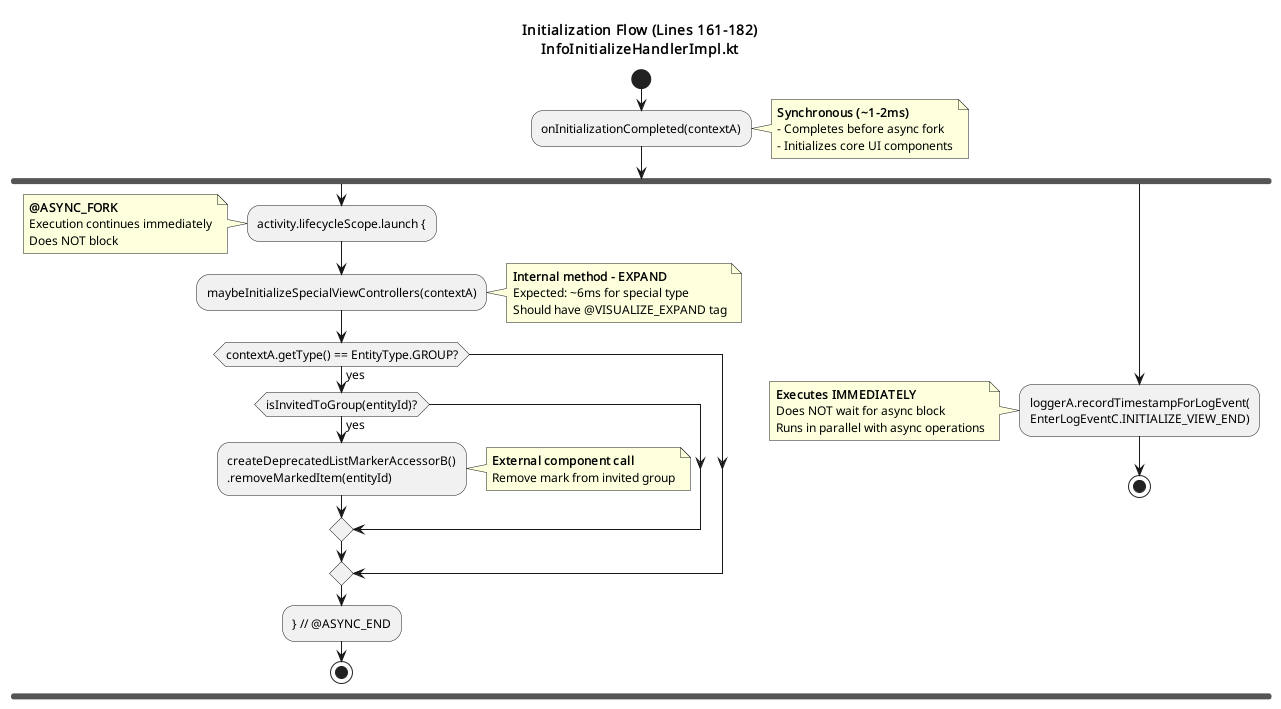
It looks good but... wait... this is way too simple; no thread information, some external calls aren't expanded.
It is possible to try and tell AI to dive into all external calls but it would generate a huge graph (in fact, it did but it is not shown here).
After all, only a human would know which part is relevant and worth digging into.
Something like initialize1000views() should be expanded. Some system calls like Handler.postDelayed() isn't needed.
I need to provide something more than a plain prompt, but how?
With comments
The first idea that came to us was to tell AI to expand a specific function like thisLooksHeavy() in the prompt. But this is almost definitely not going to work because it's not possible to customize the prompt every time with different parts of code. The functions can also be renamed, for instance.
I wanted a different way to show AI that, for certain operations of the code flow, it should dive in, track the code and expand it in the final result.
A more balanced way between changing the code and changing the prompt is to add some comments, which won't affect the original code.
Here's part of the prompt. I use @VISUALIZE_EXPAND to tell the AI that it should spend more time on this functions.
1. Scan the provided code to understand the code flow
2. Scan all method calls marked with `@VISUALIZE_EXPAND`
3. Locate parallel execution boundaries (`@FORK`, `@FORK_AGAIN`, `@FORK_END`, `@FORK_MERGE`)
4. Identify which calls are external and must be treated as leaf nodes.After reviewing the current graph, if our team has questions about specific parts such as our operations, we can add comments and ask the AI to regenerate the graph.
Threading
How about threading? How did we visualize it?
        activity.lifecycleScope.launch {
            // @VISUALIZE_EXPAND
            componentInitializer
                .initializeFinishedSharedFlow
                .flowWithLifecycle(activity.lifecycle)
                .collect(::initializeViews)
        }
This is actually a very good example of why the old-fashioned static analysis method couldn't work. Because here in the code, the variable activity is shown but it doesn't necessarily mean it's really an android.app.Activity. It can be, based on how clean your codebase is, almost anything.
Also lifecycleScope and launch , too. Theoretically, they can be anything. Unless you do a full static analysis, you could never know.
Human developers can quickly have a threading model in their mind because a human can do very quick and educated guesses, which AI nowadays can do very well, too.
When AI sees a variable called activity , it can often infer this is likely an Activity , and that the one inside the lifecycleScope.launch could very likely run on the Main thread.
Also note a more specific case here with flowWithLifecycle(activity.lifecycle).collect() where the AI recognizes the tag VISUALIZE_EXPAND , and doesn't expand the flowWithLifecycle or collect, but instead exapnds the initializeViews .
Sometimes, AI still made mistakes and couldn't map the threading in the code to the output.
  // @FORK
  launch {
    doBackgroundWork()
    // @FORK_END
  }

  // @FORK_AGAIN
  returnImmediately()

  // @FORK_MERGE
Therefore, I introduced more comment tags to help it see where the code is actually executed. However, with more powerful recent AI, this may no longer be necessary.
Another point worth noting is that if you instruct the AI to "think", it may produce more accurate results by analyzing the broader context, including other code in the codebase as well as Android framework and JDK source code. However, this takes significantly more time, often minutes, and increases cost depending on which plan you're subscribed to. Since this tool is designed for fast iteration and visualization, comment tags remain a practical and balanced choice.
Example output
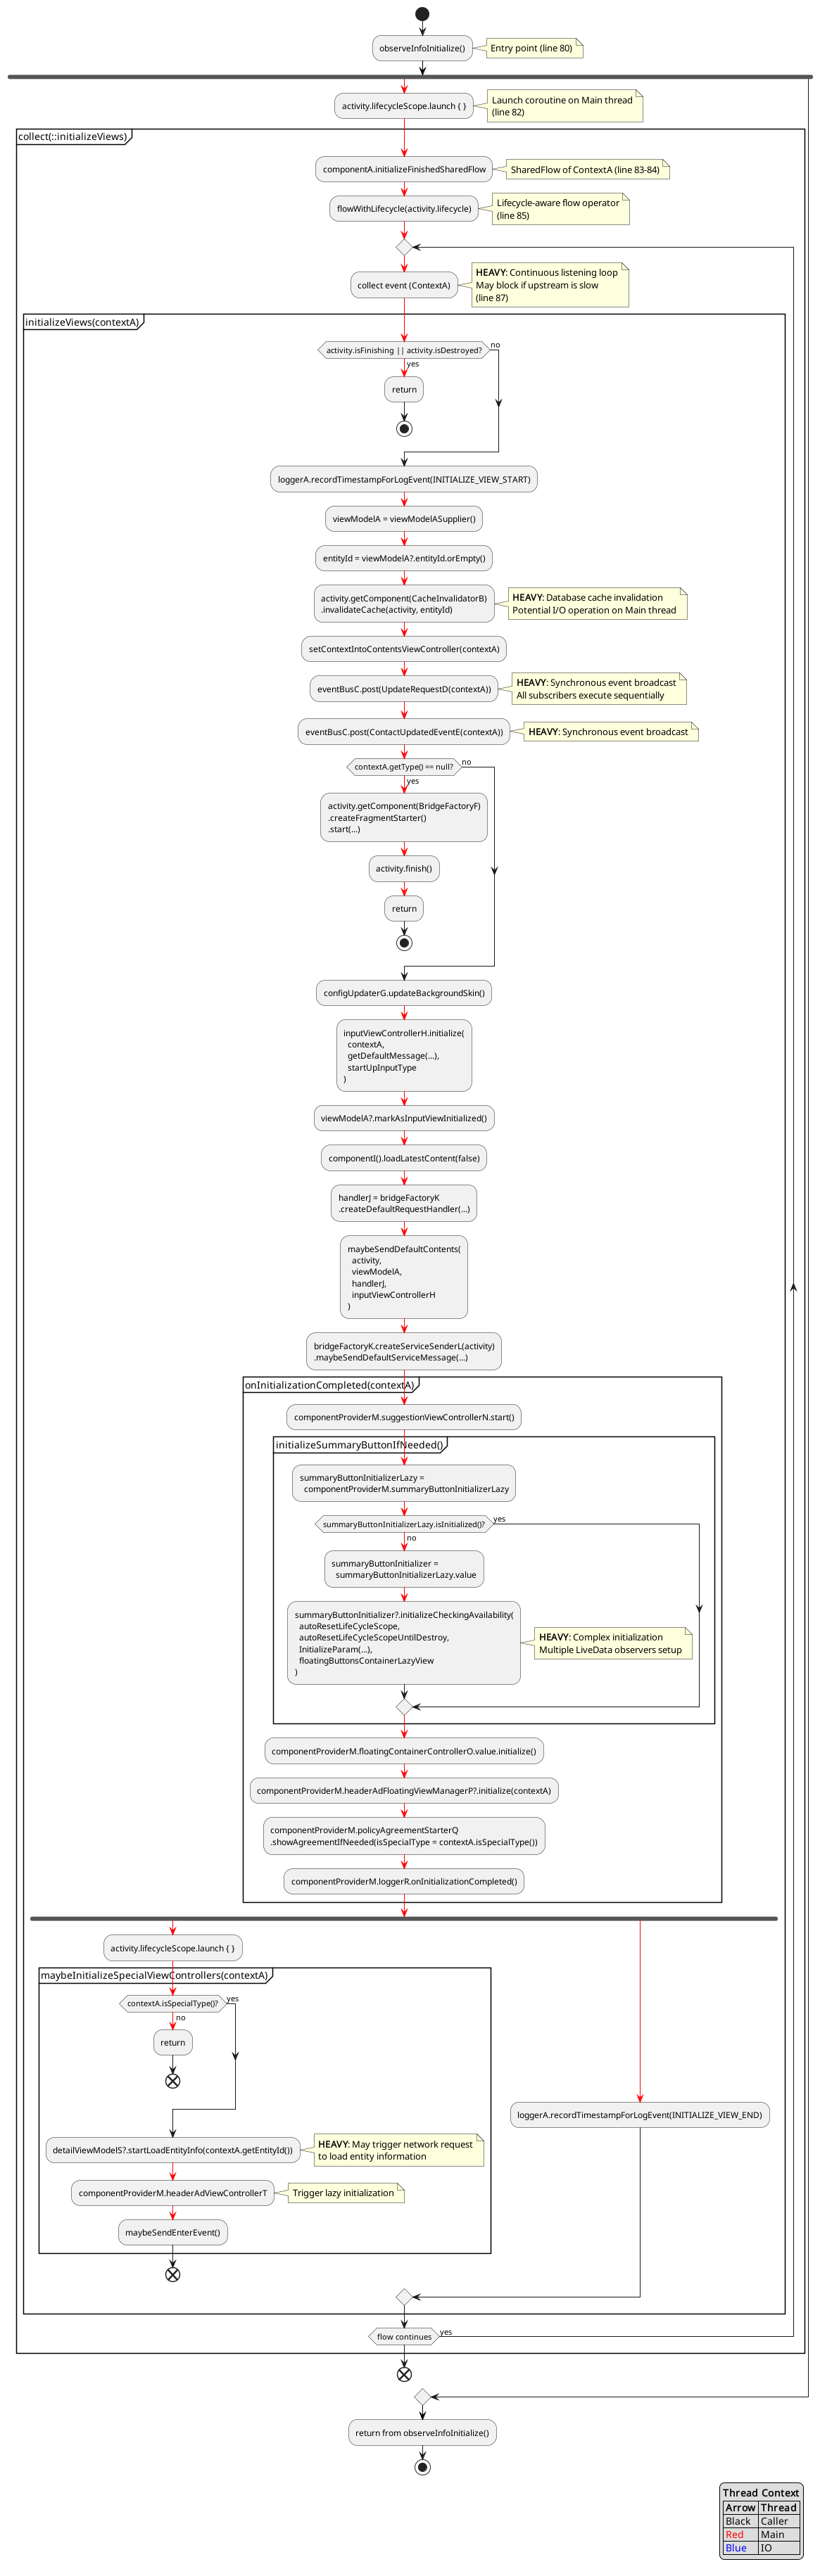
Imagine how much time it would take to make this kind of graph by hand. AI could do it in less than a few minutes. And if I see any suspicious parts I can add more comment tags manually and expand those parts.
It's also common to have AI review code. I include this in the prompt so the AI can identify potential issues while generating the diagram. As shown, the AI also makes educated guesses and adds notes when it "feels" that an operation is "heavy".
Meanwhile, at the end of the report, I ask the AI to suggest ways the code could be improved. It functions similarly to a code review bot by providing points that could be refined.
Nevertheless, in real reports, the output is often less helpful than expected because the AI doesn't perform a thorough analysis of the code.
Profiling
It's possible to work with AI to add profiling logs as well. With AI coding agents, it's possible to add code like this automatically through an AI agent:
val currentTime = System.currentTimeMillis()
Log.d("Profiling", "Operation A, start time: ${currentTime}")
operationA()
Log.d("Profiling", "Operation A, time spent: ${System.currentTimeMillis() - currentTime}")
I can run the code, collect the logs, and paste it back to the AI which will then generate the graph with time information from the logs.
This is surely limited by current AI automation tools. Asking AI to run the code on a device, reproduce the test case, and collect logs by itself is still asking a bit too much.
However, this highlights the strength of AI in mapping time-based logs to code flow, as long as sufficient context is provided.
Pull request description
Another benefit is the ability to generate before-and-after graphs for pull request descriptions. When code is moved from one location to another, the execution order can change, and this makes it easier to illustrate those differences in the pull request.
While existing code review bots offer similar capabilities, they often face the same limitations mentioned earlier, such as lacking context, not knowing where to expand, and not understanding the current threading model. With this prompt design, I can present changes more clearly.
Output choices
At first, I asked AI to generate the output in PlantUML because our internal wiki supports PlantUML. While the graph it generated is a bit old-fashioned, the code is somewhat readable.
In our experience, AI is very good at generating diagrams in SVG as well. However, if the relations are too complicated, the arrows between components can run wild (perhaps because it doesn't have real relations behind the scenes). Regarding the commonly used library Mermaid or the direct ASCII output, it's good when there aren't many components, but it becomes a bit difficult to read when the graph gets more complicated.
Note that the downside of PlantUML is that the syntax depends on its versions, and the versions supported could differ significantly in different environments. AI could fix it by checking the error logs by itself occasionally, but sometimes there are just endless errors shown on the wiki page.
However, the capability of AI is becoming stronger day by day. I think the future is probably SVG, where AI has more freedom due to the simple and fixed syntax. What's even better might be something interactive like Miro but I didn't get a chance to try it yet.
Again, if I allow AI to run an hour-long generation each time, it can probably build a 3D model for this but that's against our original requirements.
Conclusion
Using AI for "vibe coding" is something widely known and actively discussed, but building features with AI to visualize code can also be beneficial, although it's something that isn't discussed as much. To convert hard-to-read code into something visually readable, easy to understand, and analyze is something that humans may find too tedious to do, whereas AI won't have that problem.
This used to be very difficult without AI because strict static analysis cannot make good guesses. For example, determining whether a coroutine scope is Main or IO, or whether a required operation is internal or external and should be analyzed further. These days however, with a few non-intrusive comments I can make use of the best of AI and human knowledge and generate something immediately helpful for checking performance issues.
In the future, I could make this more automated and generalized and run it in CI alongside current code review bots, but with a much more specific purpose. The amount of code generated by AI will keep growing fast and tools that provide easy ways to inspect code are going to be necessary (with help from AI, of course). Hopefully what I have experimented here can give you some inspiration when you read this. Thank you very much for reading!