This is the official article for Tech-Verse 2026, LY Corporation's technology conference.
Hello. We are Hashimoto (product manager) and Okada (product owner) of PJ One Piece, a project that aims to "stitch" analyses together using AI agents.
PJ One Piece leverages generative AI to connect business questions, data analysis, insight synthesis, and consideration of next actions through an analysis AI agent. In early deployments, analyses that previously took an average of about two weeks from request to result can now be executed in about ten minutes, enabling hundreds of analyses per month within business units.
This article describes how we aim to "stitch" business, data, analysis processes, and domains together using generative AI, and how the role of data scientists is evolving in the process.
Three underlying divides
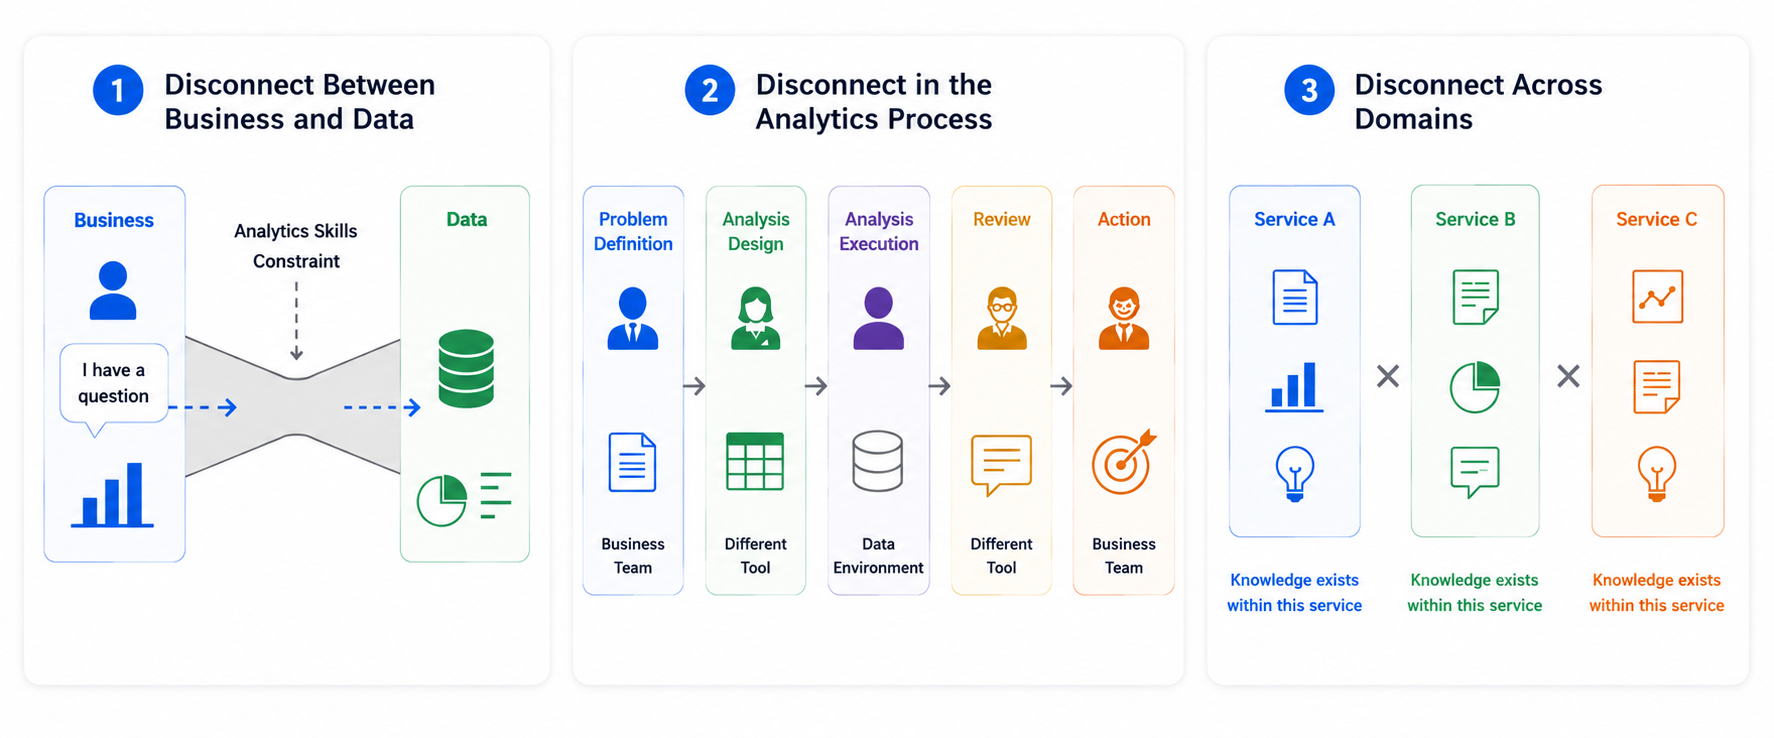
The starting point for PJ One Piece was three divides in analytics work.
- The divide between business and data
- The divide in the analysis process
- The divide between domains
These three divides prevented business questions from reaching data, caused the analysis process to lose its original purpose and veer off unexpectedly, and made it difficult to reuse domain-specific knowledge. The severity varied by business, but the divides interacted and affected the speed and quality of data use in each business.
Let's examine each divide in more detail.
First, the divide between business and data. Even when data warehouse (DWH) and business intelligence (BI) were in place and data was accessible, barriers remained for business teams to obtain the right information at the right time on their own. Questions such as how to write SQL, which tables and columns to use, which metrics and definitions to apply, how to find meaningful signals amid many changes, and how to interpret and use the resulting figures continued to require judgment. Even with a data foundation, the last mile of data use remained.
Second, the divide in the analysis process. This divide occurs when task definition, analysis design, execution, review, and action are separated due to differences in owners, tools, or timing, causing context to be easily lost. If the requester's business background or decision objective is not fully documented or the analysis design intent is not properly conveyed to execution or review, misunderstandings and rework occur. When processes are disconnected, waiting times arise between stages and lead time grows longer than the actual work time, resulting in uneven analysis quality and slower conversion of insights into action.
Third, the divide between domains. When a business domain changes, the analyst changes as well, and service assumptions, KPI definitions, comparison viewpoints, table structures, policies, and user behavior context also change. As a result, analytical techniques or patterns developed in one domain often remain confined and are not reused in others. Although many analyses share similar structures—policy evaluation, funnel analysis, user understanding, root cause analysis, and effect measurement—when domain-specific background knowledge, table definitions and usage rules, past decision rationale, review perspectives, and learned lessons are siloed, it is difficult to spread analytical assets across the organization.
PJ One Piece aims to redesign workflows, knowledge, data, human roles, and organizational structure around AI to "stitch" these three divides into one. At the center is an analysis AI agent that autonomously performs analyses.
Stitching analysis together with an analysis agent
In this context, the analysis agent is a mechanism that carries out the flow data scientists normally perform—clarifying questions, finding necessary data, aggregating and analyzing, interpreting results, and linking to next actions—while leveraging internal systems. Users submit requests in natural language through an entry point such as a chat interface; the agent interprets the objective, formulates an analysis plan, uses tools to gather information, and summarizes the results.
What we mean by "stitching" is connecting the series of activities and assets around data analysis. This addresses the three underlying divides described above.
First, connecting business and data. Rather than having business stakeholders simply request analyses and wait for results from data scientists, we aim for a state where they can pose questions and carry analyses through to proposing next actions themselves. For example, asking in natural language "Did last week's campaign improve sales, and which touchpoint should we improve next?" should allow analysis to start without requiring knowledge of SQL or table structures.
Second, connecting the analysis process. The agent does not merely return partial outputs like SQL or aggregate results; it preserves the user's goal and contextual flow, organizes decision-relevant points, confirms campaign targets and comparison periods, performs aggregations and specialist analyses, interprets results, and compiles visualizations or reports to help resolve the user's objective. If needed, it proposes additional analyses and accompanies the user to the point where they can decide on next actions.
Third, bridging domains. By formalizing analyses into an analysis agent, analytical knowledge itself becomes reusable and continuously improvable. The process of clarifying questions, defining requirements, choosing metrics and comparison axes, review viewpoints, and deciding on additional analyses is logged, revealing where assumptions are lacking or rework is likely, and enabling process improvements. Frequent analysis patterns are generalized into Skills so they can be reused by other owners or in other domains.
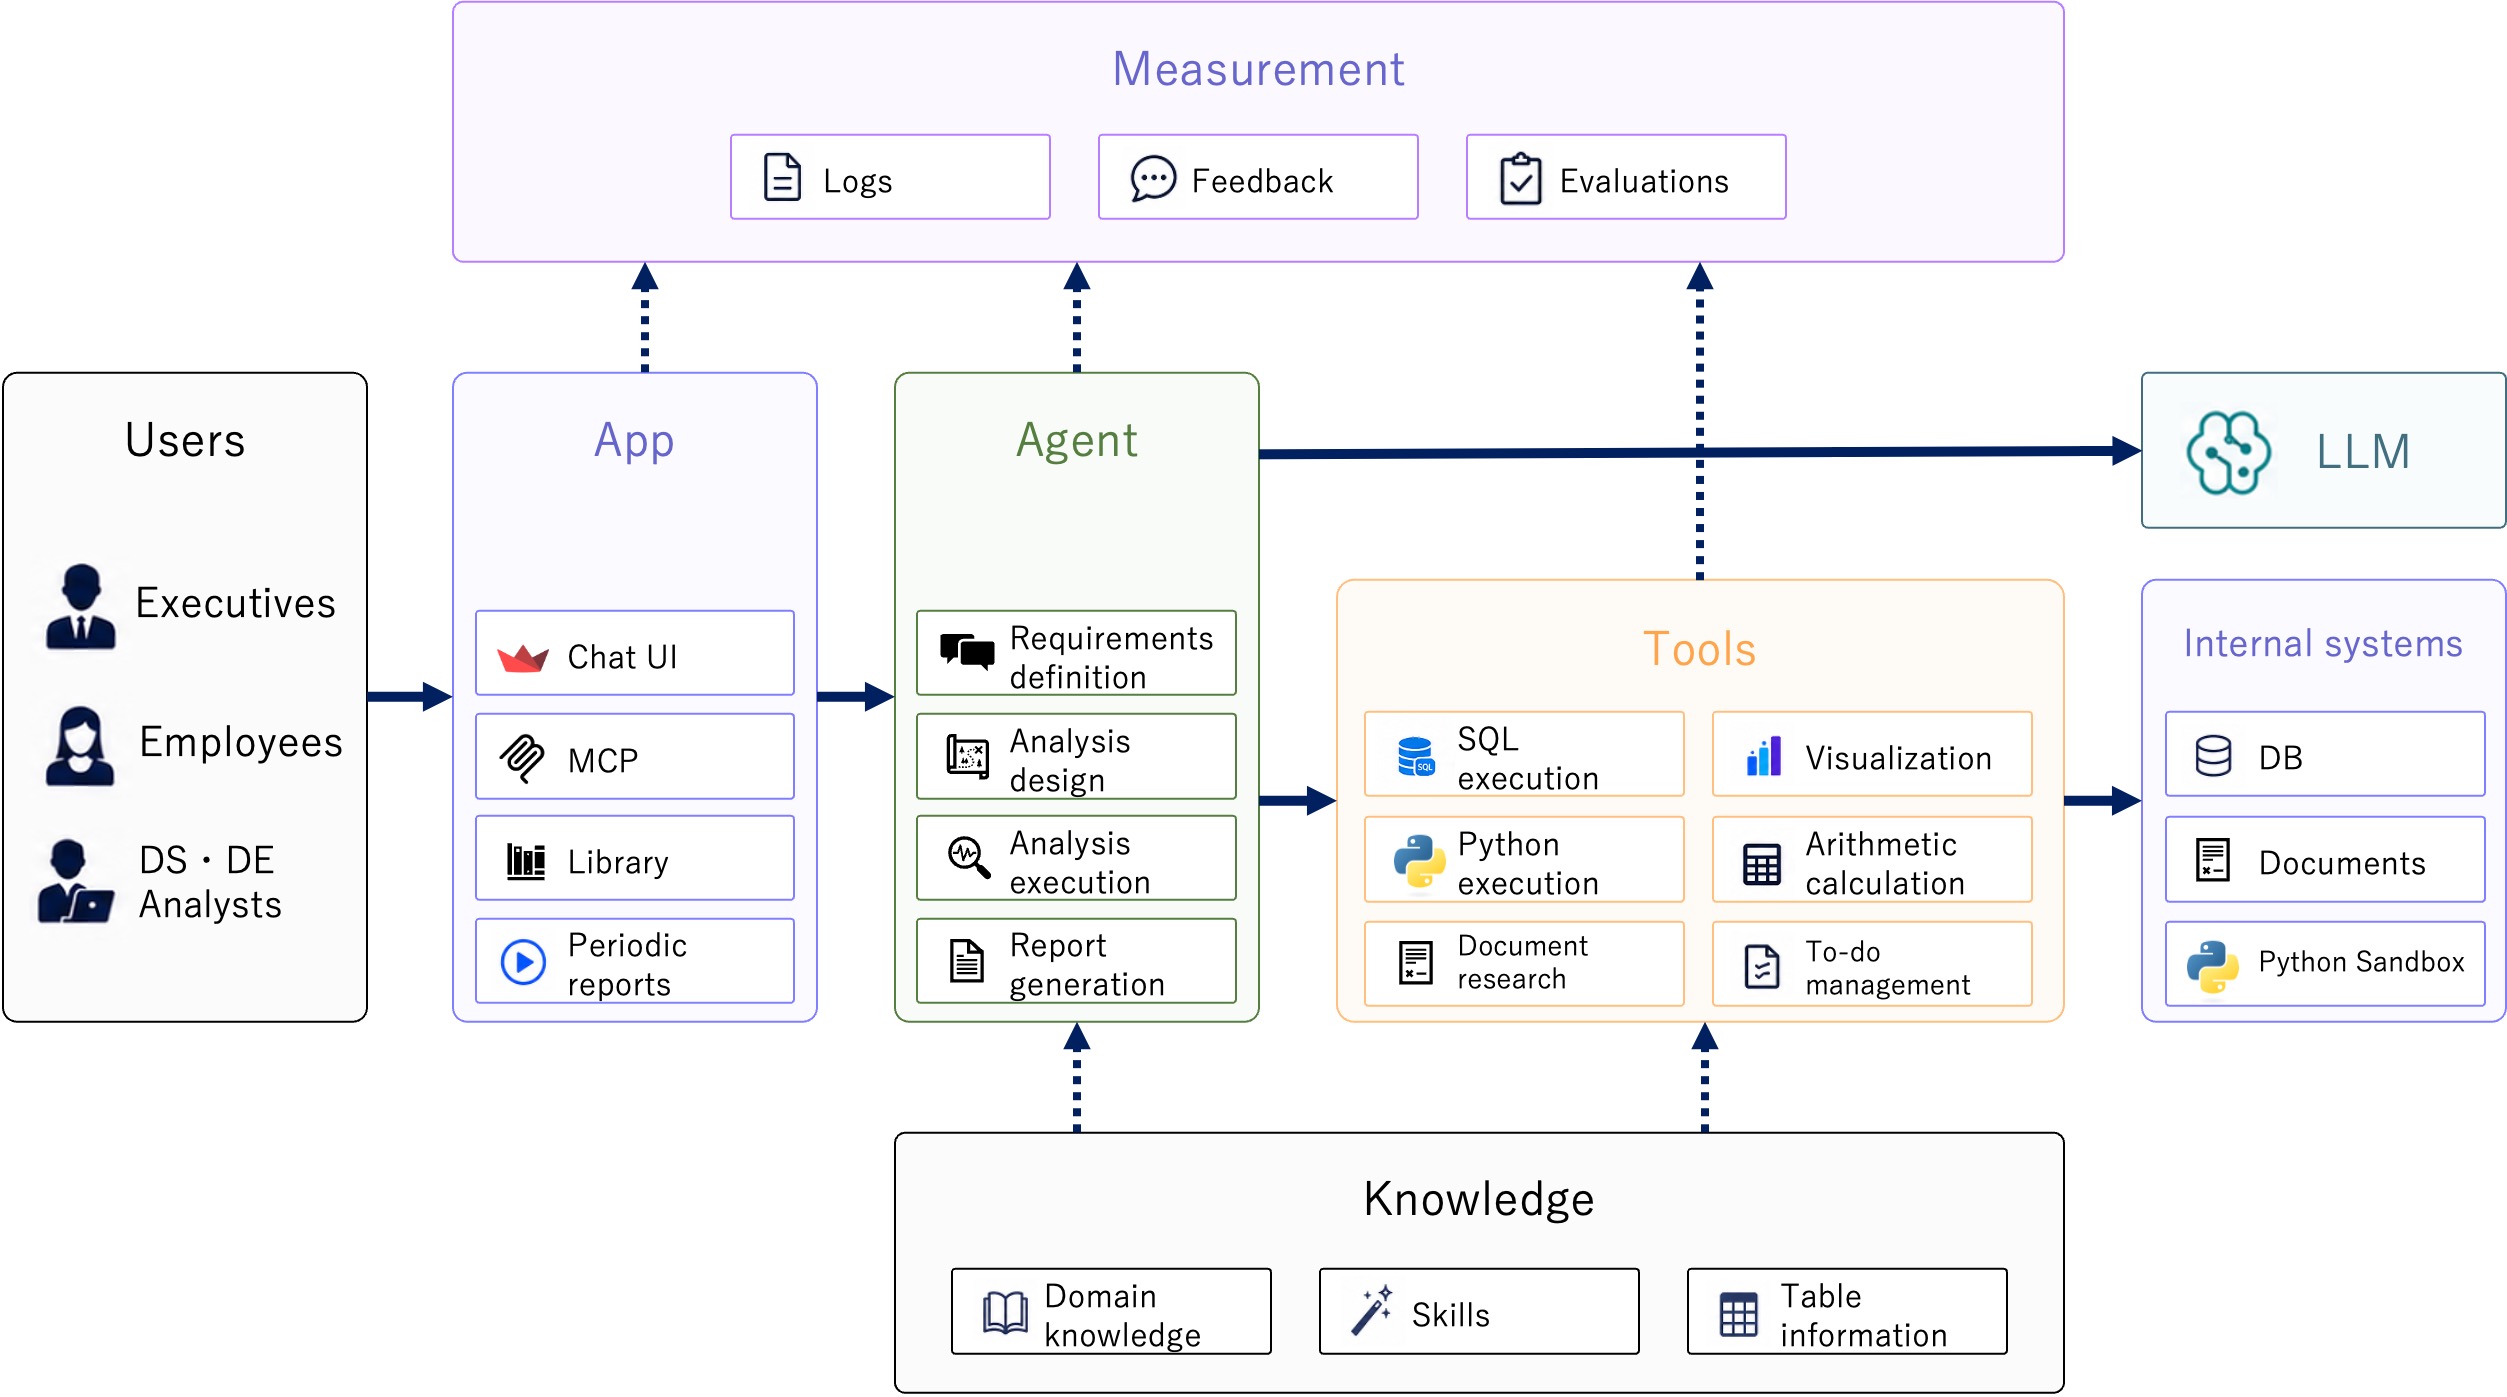
The overall architecture supporting these capabilities can be organized into five main components.
- An application that serves as the user's entry point
- An LLM-based agent that performs reasoning and tool use to achieve user goals
- Tools for SQL execution, Python execution, internal documentation search, and visualization
- Knowledge sources providing domain knowledge, Skills, and table information
- Measurement for logging the agent, collecting user feedback, monitoring, and evaluation
Knowledge areas are designed as a plugin structure that can be extended per product domain, and execution logs and feedback are used for improvement, so knowledge and analytical patterns accumulate with use. In other words, PJ One Piece's analysis agent is designed not as a simple LLM chat application but as an analysis execution platform that combines the application, agents, tools, knowledge, and measurement.
Design and techniques for stitching analysis together
Achieving these three connections requires more than simply automating analyses. We need to design the series of activities and assets around data analysis as a single system. Below we organize four technical challenges that became apparent during implementation and operation.
1. Converting business questions into an analysis-ready context
The first challenge is turning a user's natural-language question into clear analysis requirements. Rather than asking users to write detailed analysis specs, the agent references domain knowledge and table metadata and only asks the user to confirm missing assumptions.
A question like "Did last week's campaign improve sales?" contains many implicit assumptions—target campaign, period, KPI, comparison baseline, granularity, exclusion conditions, and so on. If these assumptions remain vague, the divide between business and data persists.
Expecting users to provide all these details in every prompt is unrealistic. Users should express "what they want to know", not detailed instructions that assume familiarity with data structures and analysis design. The system therefore needs to augment the user's natural question with background assumptions and convert it into concrete analysis requirements.
To do this, we manage domain-specific knowledge—service understanding, KPI definitions, aggregation caveats, how to locate campaign information, and review checklists—as persistent domain knowledge rather than something to include in each prompt. We also maintain table metadata that explains which tables and columns to use in which scenarios.
With this design, users can start analyses without knowing SQL or table schemas. The agent references business context and table metadata to determine which items are fixed and which need clarification, and it only prompts the user for the missing items—minimizing user burden while solidifying analysis requirements. This forms the foundation for connecting business and data.
2. Reaching the necessary data safely and reliably
The next challenge is ensuring the agent can reach the data needed for analysis safely and reliably. The agent must have detailed table metadata to use data accurately, but in large domains the number of tables and columns is large and documenting all usage caveats can be voluminous. Including everything in the LLM input inflates context, makes it easy to miss needed information, increases token costs, and harms response speed and inference stability.
We separate lightweight table lists from detailed per-table information and use staged disclosure. The agent first consults a table index to narrow candidate tables and then fetches detailed information for the selected tables—column definitions, examples, partitioning, and usage notes—before composing SQL. This lets the agent get the right knowledge when needed, rather than feeding everything at once.
Operational tables or DWH schemas are not always convenient for analysis; reaching the desired aggregation may require many filters and JOINs, which raises SQL generation complexity. To avoid exposing raw transactional schemas directly, we provide analysis-optimized wide tables (denormalized ledger tables that join transaction data with attributes) as logical views or physical tables surfaced to the agent. This lets the agent perform many aggregations with simple filters and reduce SQL complexity and risk.
We also enforce system-side checks before and after SQL execution: restrict to SELECT-only, validate against published table contracts, ensure partition constraints, limit sensitive or personal data access, and cap result row counts. These guardrails reduce the risk of incorrect queries or excessive data retrieval and allow the agent to operate with reasonable freedom in a safe environment.
3. Maintaining context from design through execution and interpretation
The third challenge is keeping context intact across analysis design, aggregation, visualization, interpretation, and review. Generating SQL alone does not stitch the analysis process. The system must reason about which comparisons matter, which axes and granularities yield useful insights, whether the result satisfies the user's goal, and what follow-up analyses are required.
We use a supervisor-style multi-agent architecture: a main agent manages the overall plan and context and delegates specialist tasks to subagents with focused roles—for example, statistical tests, time-series analysis, clustering, or review checks. The main agent retains the request, objectives, findings, and next decision points, while subagents execute specialized tasks without bloating the global context.
This separation lets the main agent preserve the overall narrative while subagents handle exploratory or expertise-heavy work that would otherwise overload context. It enables deep analysis and independent review while keeping the process coherent.
Analysis tasks can also run longer than a single chat interaction. Sharing progress—what was discovered, the design, available and unavailable data, and constraints—helps users adjust direction and priorities as the work proceeds.
4. Treating the analysis agent as a shared asset and continuously evolving it
The final challenge is making the analysis agent more than a point tool for individual tasks: it should be an organizational capability that continuously improves. The important part is converting domain knowledge, analysis techniques, review viewpoints, interpretation patterns, and lessons learned into reusable assets for future analyses and other domains.
Usage logs and feedback are critical. Logs reveal what inputs produced which outputs, what actions the agent took during execution, how it confirmed assumptions, what analysis designs and SQL it generated, and which analyses failed. Combining logs with user and analyst feedback turns prompts, tools, data, and Skills into a prioritized improvement backlog.
Recurring analysis patterns are captured as reusable Skills. Some Skills are generic—time-series analysis or clustering—usable across domains; others are domain-specific, such as monthly report generation or campaign monitoring. Each Skill documents prerequisites, comparison axes, caveats, and interpretation guidelines.
Accumulating Skills and an improvement backlog transforms siloed domain knowledge into organization-wide analytical capability. Treating the agent as an execution platform—accessible from multiple entry points but using consistent table contracts, Skills, and review criteria—lets knowledge and analysis assets accumulate with usage and expands the range and quality of analyses that can be handled.
Analysis lead time from two weeks to ten minutes: Business value observed in early deployment
PJ One Piece's analysis agent was piloted in several service business units and adopted widely from product owners to on-the-ground staff. The biggest impact in early deployments was dramatically accelerating data usage within business units. The platform has grown into an analysis foundation used by more than half of a business unit. It is no longer a tool only for data scientists; it is an entry point for users to "try asking first" as part of daily work.
The most noticeable change was analysis lead time. When humans handled requests, it took about two weeks on average from request to result; with the analysis agent, results can be obtained in about ten minutes. Detailed analyses of the previous day's results can now be ready in time for next-morning meetings and campaign discussions.
The number of analyses within business units also changed significantly. When the analysis team handled requests, about ten analyses per month was a realistic upper limit. Now, hundreds of analyses are executed inside business units. While the increase in volume itself is important, more significant is that questions previously deemed "not worth requesting" or postponed due to queueing are now being analyzed.
- How did sales and orders move during the campaign period?
- Which products are currently popular with which user groups?
- Which touchpoints or segments are driving changes in metrics?
If you look at each of these questions individually, they are not necessarily advanced analyses. However, they frequently appear in business decision-making and timing is important. Relying on the analytics team's resources to handle them makes it hard to run every analysis, and even when performed there is a wait that reduces the freshness of the information. Analysis agents alleviate this bottleneck in data use.
How does the role of data scientists change?
Another major change after introducing analysis agents is that data scientists' value and productivity have increased. When business units can run analyses themselves, the workload for data scientists does not shrink; rather, the nature of their responsibilities changes. In other words, analysis agents do not replace data scientists; they expand expertise that would otherwise remain request-driven into business problem discovery and systematizing analytical capabilities.
Previously, much of a data scientist's work involved receiving analysis requests, clarifying requirements, writing SQL, aggregating data, creating visualizations, and summarizing insights. While these skills remain important, because analysis agents handle execution, data scientists no longer need to directly resolve every analysis request.
Instead, they increasingly participate in higher-level business strategy and planning, identifying, proposing, and solving important problems themselves. In short, their role is shifting from fixing already apparent problems to defining and addressing potential business challenges.
Data scientists' productivity has also improved significantly. Project productivity has roughly doubled compared with before analysis agents were introduced. This reduces person-hours per project while enabling many more projects to be carried out.
Thanks to these role changes and productivity gains, teams can invest time in building reusable analytical assets like analysis agents. This is an investment to continuously improve analytical capabilities beyond short-term project work. By organizing general-purpose and domain-specific Skills, analysis tables, and report formats, future analyses can be faster and more reliable.
In short, business units can run analyses themselves, and data scientists can reallocate time saved from ad-hoc requests to solving more important problems or advancing the analysis agents themselves. I believe this is where new value for analytics organizations lies in the generative AI era. The key is designing what to entrust to AI and what to assign to people. AI excels where the task is clear, it can autonomously access the necessary information, and it can then collect information while reasoning and acting. Humans should identify the truly important questions to be solved and pursue desirable solutions even when it is difficult.
Conclusion
The name PJ One Piece expresses the desire to "stitch analysis together". The arrival of generative AI has begun to significantly change how analyses are performed. What really matters is not "how far can we automate with AI", but "how can we connect business questions, data, analysis processes, and domain knowledge, and how can we turn the resulting insights into the next decision and the next analysis".
The role required of analytics organizations in the generative AI era is not simply handing analyses to AI. It is important to design workflows, knowledge, data, and human roles so AI can perform effectively.
We will continue developing structures that accumulate knowledge and execution capability in the organization rather than treating analyses as one-off tasks. Through this, we aim to make data use not the domain of a few specialists but the power of many people who drive the business.
Tech-Verse 2026 to Be Held on June 29

This article has been published as the official article for the event.
Tech-Verse 2026 is a technology conference hosted by LY Corporation.
Explore cutting-edge challenges and real-world insights.
Be sure to watch the event live on YouTube LIVE.
https://tech-verse.lycorp.co.jp/2026/en/