Generated by Microsoft Designer
背景
在前一篇Loki系列文章中,提到我們利用金絲雀部署的方式,利用Vector複製真實環境的log送往新版Loki,在此同時調整Loki config進行效能調校,直到結果滿意之後,再開放給團隊使用。
因為我們的Loki是使用分散式模式部署,涉及多個功能不同的component,使得Loki架構非常複雜,在調整細項config之前,要非常清楚了解各個component間的關係,才能依序並且合理的調整config。
在調教Loki時,可以先針對寫入相關的component做調整,例如ingester及distributor,甚至是在前一篇文章中的提及的log collector,目標是讓寫入的chunk的Flush Reason盡可能是Full,避免碎片化chunk的問題。不僅能夠在空間上更有效率的存放,也同時能夠間接的影響query速度。
原因是相比於碎片化的chunk,滿載的chunk代表我們僅需更少數量的chunk,就能表示相同的log量,最終導致Loki在建立chunk的index也跟著減少。在查詢這些log時,Loki會依照query內容去查index,因為查到index後得知這些chunk數量是少的,也就花費更少的時間讀取chunk內容,讓querier可以專注在執行面,減少整體query時間開銷。
所以,我們花費大量的時間調校Loki的寫入效能,進而調整讀取效能,以下文章會分別針對寫入以及讀取,詳細說明各項config調整內容。
Loki write config調整
ingester
ingester.chunk-encoding:直接設定成snappy,跟gzip相比雖然不是最大的壓縮比,但是速度較快,壓縮比也還能接受,官方config以及官方blog也推薦使用。
shard-streams.enabled:在調整Loki labels後,stream數量會變少,但是每一條stream的log量會變大,可能會超過ingester.per-stream-rate-limit限制造成rate limit。開啟這個參數以後,如果某一條stream量超過shard-streams.desired-rate,會被分成多個stream shard,distributor會自動為這些stream shard加上__stream_shard__ label,邏輯上會變成不同的stream,讓ingester有能力消化這些log。
ingester.per-stream-rate-limit:如果開啟shard-streams.enabled還是會碰到rate limit,在ingester資源充足前提下,可以上調這個數值。
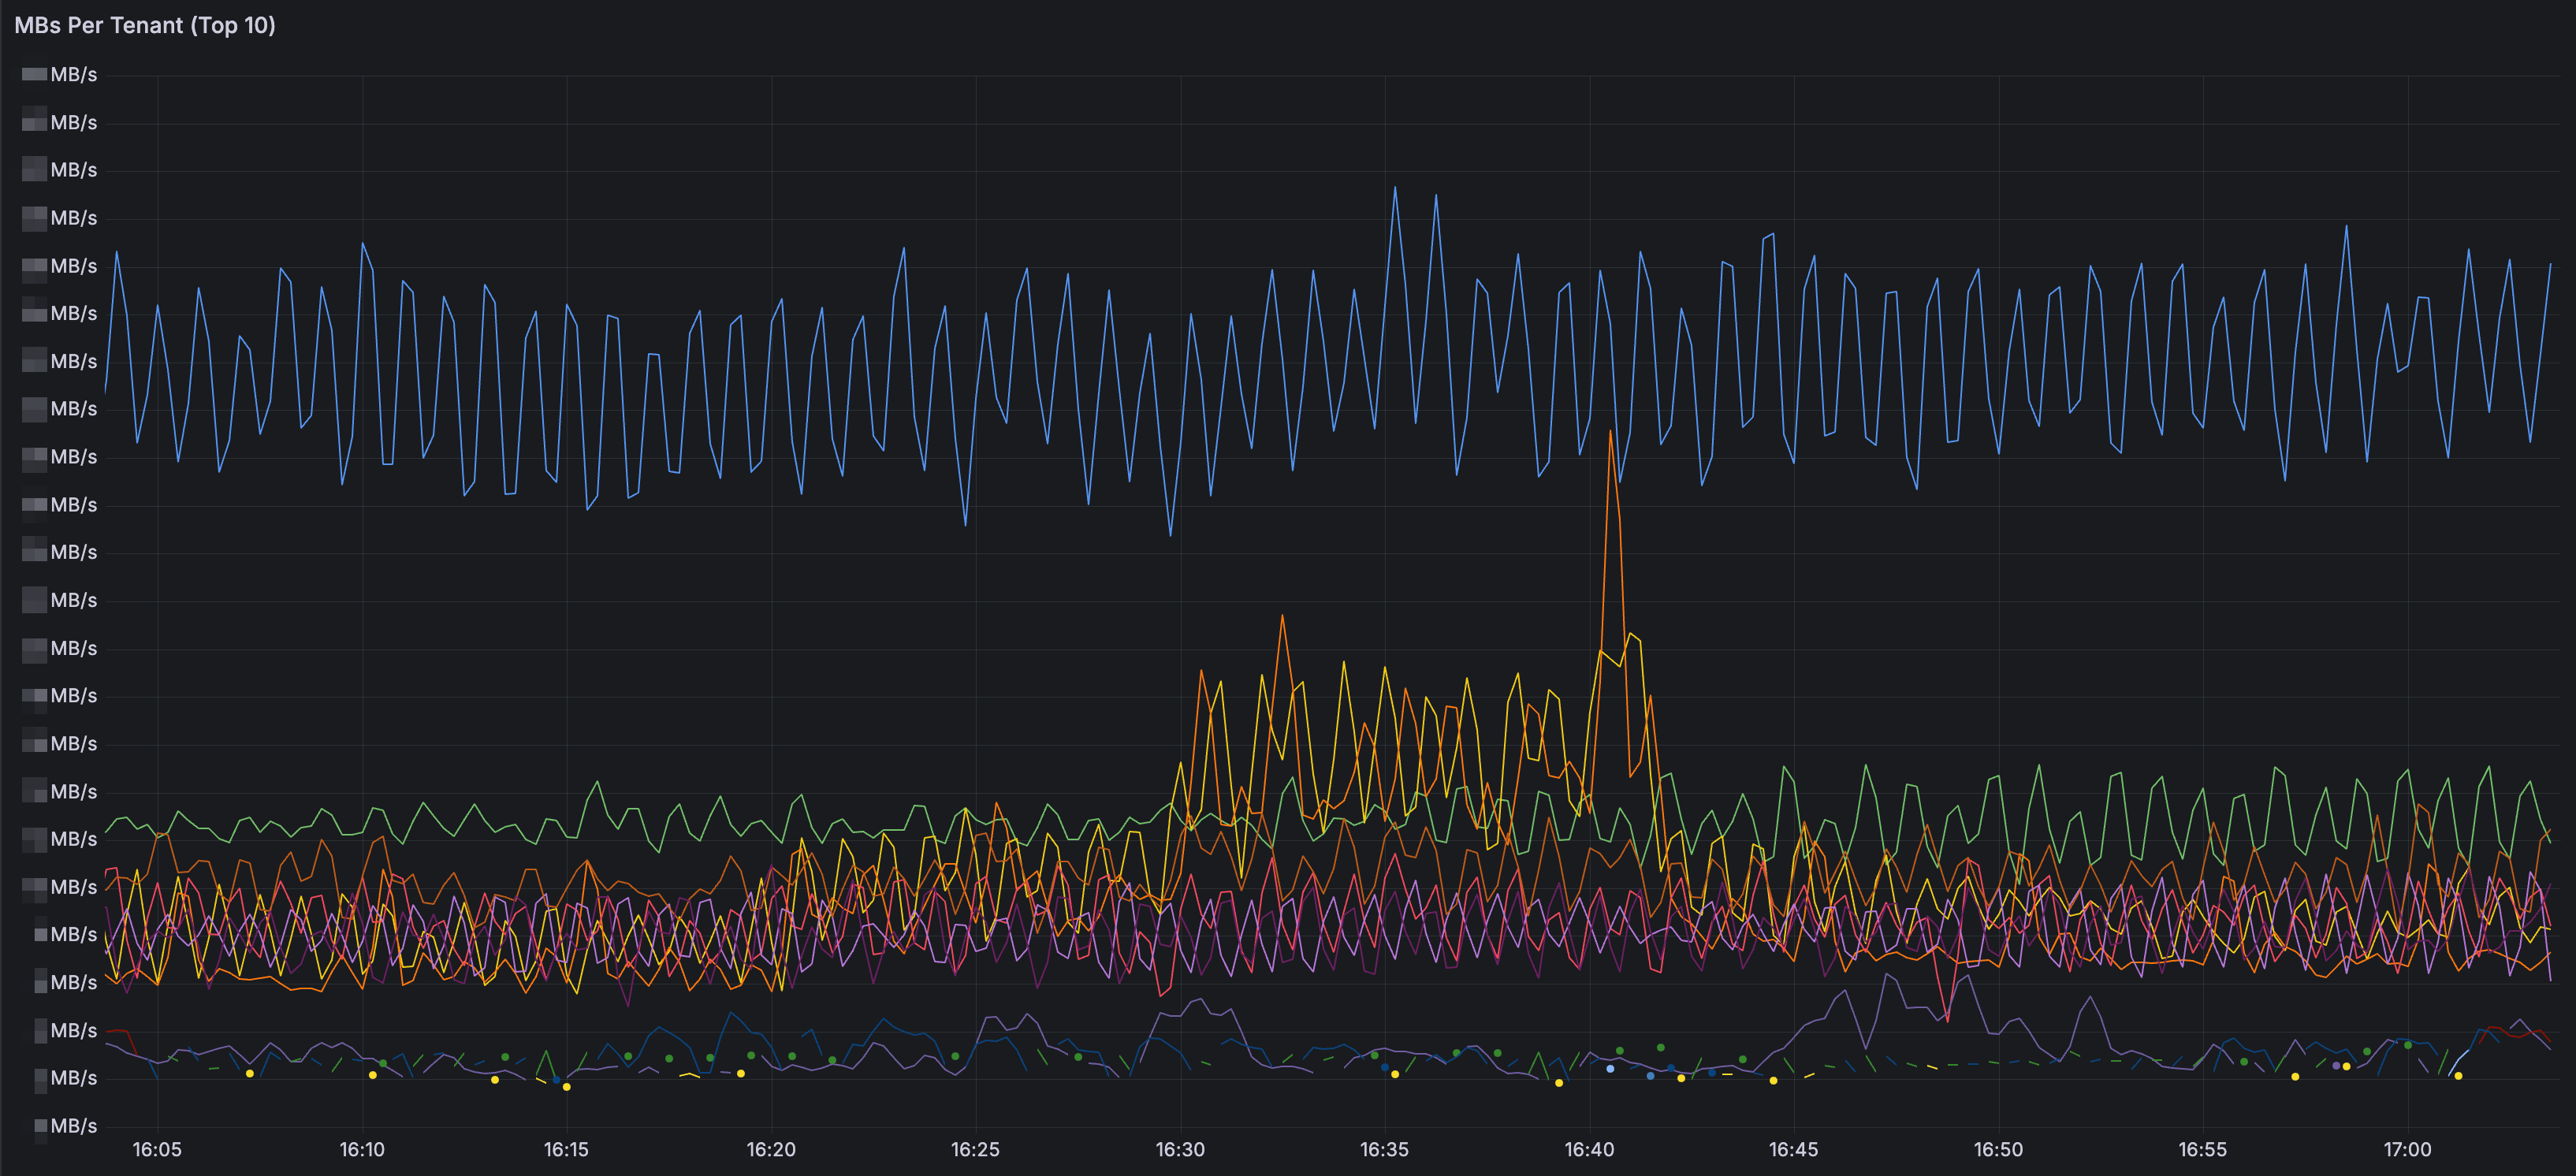
distributor.ingestion-rate-limit-mb:可以參考Loki Operational Dashboard中MBs Per Tenant Panel裡的語法,並使用PromQL加總每一個tenant的log量,進而計算出合理的全局rate limit,distributor.ingestion-burst-size-mb需要也可以一併更新。
ingester.max-chunk-age:雖然官方blog曾建議將這個數值設定成2h,不過按照前一篇提及的方法調整過Loki labels後,我們將這數值上調到4h。同時,ingester.chunks-idle-period也調整成4h。我們刻意多等待2小時,讓一次性任務或是排程的log streams能利用這段時間寫到相同的chunk,讓Chunk Flush Reason更有機會從max age轉成full。另一個帶來的效益是如同官方 blog提及的,我們能接受更早的out-of-order ingestion,這對我們非常有幫助,如果我們在Vector config有瑕疵,誤送一些錯誤處理的log到Loki去,多出來的這段時間能幫助我們排障,即時處理完後讓Loki不要因為out-of-order拒絕接受log。最後,雖然上調這個參數會小幅度的增加ingester記憶體使用,但這遠小於調整Loki labels節省的量,所以是可以接受的。
ingester.readiness-check-ring-health:如果ingester的replica一多,在重啟 ingester statefulset時候預設會去檢查ingester ring上的健康程度,這時光是等待單顆ingester可能就消耗10分鐘,可以考慮將這數值改成false,僅檢查ingester自己的健康狀態,減少等待時間到2分鐘。
distributor.zone-awareness-enabled:這個參數已經在grafana/loki helm chart的ingester.zoneAwareReplication有良好的封裝。如同以下例子,只要指定ingester的replica數量以及affinity,就能將不同的ingester平均部到不同的AZ,達成更高可用性的寫入。
ingester:
replicas: 12
zoneAwareReplication:
  zoneA:
    extraAffinity:
      nodeAffinity:
        requiredDuringSchedulingIgnoredDuringExecution:
          nodeSelectorTerms:
          - matchExpressions:
            - key: nodepool
              operator: In
              values:
              - loki
            - key: availability-zone
              operator: In
              values:
              - az-1
  zoneB:
    ...
  zoneC:
    ...
distributor
distributor.client-cleanup-period:在Loki架構中,distributor會每隔一段時間,向ingester要每一條stream的log量,當作rate limit的參考。另外,distributor會每隔distributor.client-cleanup-period進行client的更新,移除不存在的ingester連線。在重啟ingester過程中,distributor如果沒有即時更新ingester連線,就有可能會誤送log給不存在的ingester。可以考慮縮減這段時間,更快移除這些不健康的連線避免錯誤。
distributor.rate-store.ingester-request-timeout:如果因為網路的不穩定,造成distributor向ingester的請求時間較長造成timeout,可以稍微增加這個數值,避免distributor發生錯誤。
Loki read config調整
querier
關於Loki querier的調整可以直接參考官方blog的詳細說明,作者特別使用精美的動畫說明querier相關的參數是如何影響query行為,也提供了各類metrics幫助Loki管理者發現當前問題。
在blog中,我覺得對調整最有幫助的是以下的LogQL語法(已依據使用情境做些調整)。
 {component="querier", cluster="$cluster", namespace="$namespace"}
  |= "metrics.go"
  | logfmt
  | latency="slow"
  | query_type="metric" or query_type="filter" or query_type="limited"
  | label_format
      duration_s=`{{.duration | duration}}`,
      queue_time_s=`{{.queue_time | duration}}`,
      chunk_refs_s=`{{.chunk_refs_fetch_time | duration}}`,
      chunk_total_s=`{{.store_chunks_download_time | duration}}`,
      cache_download_chunk_s=`{{.cache_chunk_download_time | duration}}`
  | label_format total_time_s=`{{addf .queue_time_s .duration_s}}`
  | label_format
      queue_pct=`{{mulf (divf .queue_time_s .total_time_s) 100 }}`,
      index_pct=`{{mulf (divf (.chunk_refs_fetch_time | duration) .total_time_s) 100 }}`,
      chunks_pct=`{{mulf (divf .chunk_total_s .total_time_s) 100}}`,
      execution_pct=`{{mulf (divf (subf .duration_s .chunk_refs_s .chunk_total_s) .total_time_s) 100}}`,
      cache_download_pct=`{{mulf (divf .cache_download_chunk_s .chunk_total_s) 100}}`,
      avg_chunk_size=`{{divf (divf (bytes .total_bytes) .cache_chunk_req 1000)}}`
  | line_format `| total_time {{printf "%3.0f" (.total_time_s | float64)}}s | queued {{printf "%3.0f" (.queue_pct | float64)}}% | execution {{printf "%3.0f" (.execution_pct | float64)}}% | index {{printf "%3.0f" (.index_pct | float64)}}% | store {{printf "%3.0f" (.chunks_pct | float64)}}% (cache {{ printf "%3.0f" (.cache_download_pct | float64) }}%) | avg_chunk {{printf "%3.0f" (.avg_chunk_size | float64)}}kB | {{ .query }}`
他會呈現發生slow query(執行時間大於10秒)時,querier在執行subquery時,在4個不同的phase所花費的時間:
queued:在queue中等待的時間
index:根據Loki label查index花費時間
store:拿到index後,從cache或object storage拿chunk時間
execution:取得chunk後,在querier中執行的時間
我們應盡可能讓execution比率愈高愈好(超過80%),因為這代表querier真正花費CPU時間計算結果,而不是在等待IO,如果發現query時間花在其他的phase,blog也有提到如何做對應的調整,在此不再贅述。
除此之外,我們特別調整store的呈現,多一個cache代表querier在拿chunk時,在cache中花費的時間,這個比率應該盡可能接近100%,代表拿chunk的時間主要花費在更快的cache,而不是慢得多的object storage。這對我們非常有幫助,讓我們發現先前的chunk cache是非常沒有效率的,需要額外調校,在之後會說明。
chunk cache
如果有讀過這篇官方blog,一定會覺得如果Loki的chunk cache改成Memcached,並使用extstore掛載快速的SSD,能用更多的空間以及相對便宜的成本,為Loki query帶來極高的效能。我們也像文章中一樣嘗試計算現有的LogQL查詢區間熱區,文章中並沒有提及實際的query語法,不過我們是使用以下LogQL搭配熱力圖呈現。
sum_over_time({cluster="$cluster", namespace="$namespace", app="loki", component="query-frontend"} |= "metrics.go"
  |= "query_type" | logfmt | query_type="metric" or query_type="filter" or query_type="limited"
  | unwrap duration(start_delta)[5m])
由下圖可以看到,大部分的查詢區間都落在過去9小時以內。在討論後我們最後決定cache應至少能保留過去一天的chunk,進而計算cache需要的空間。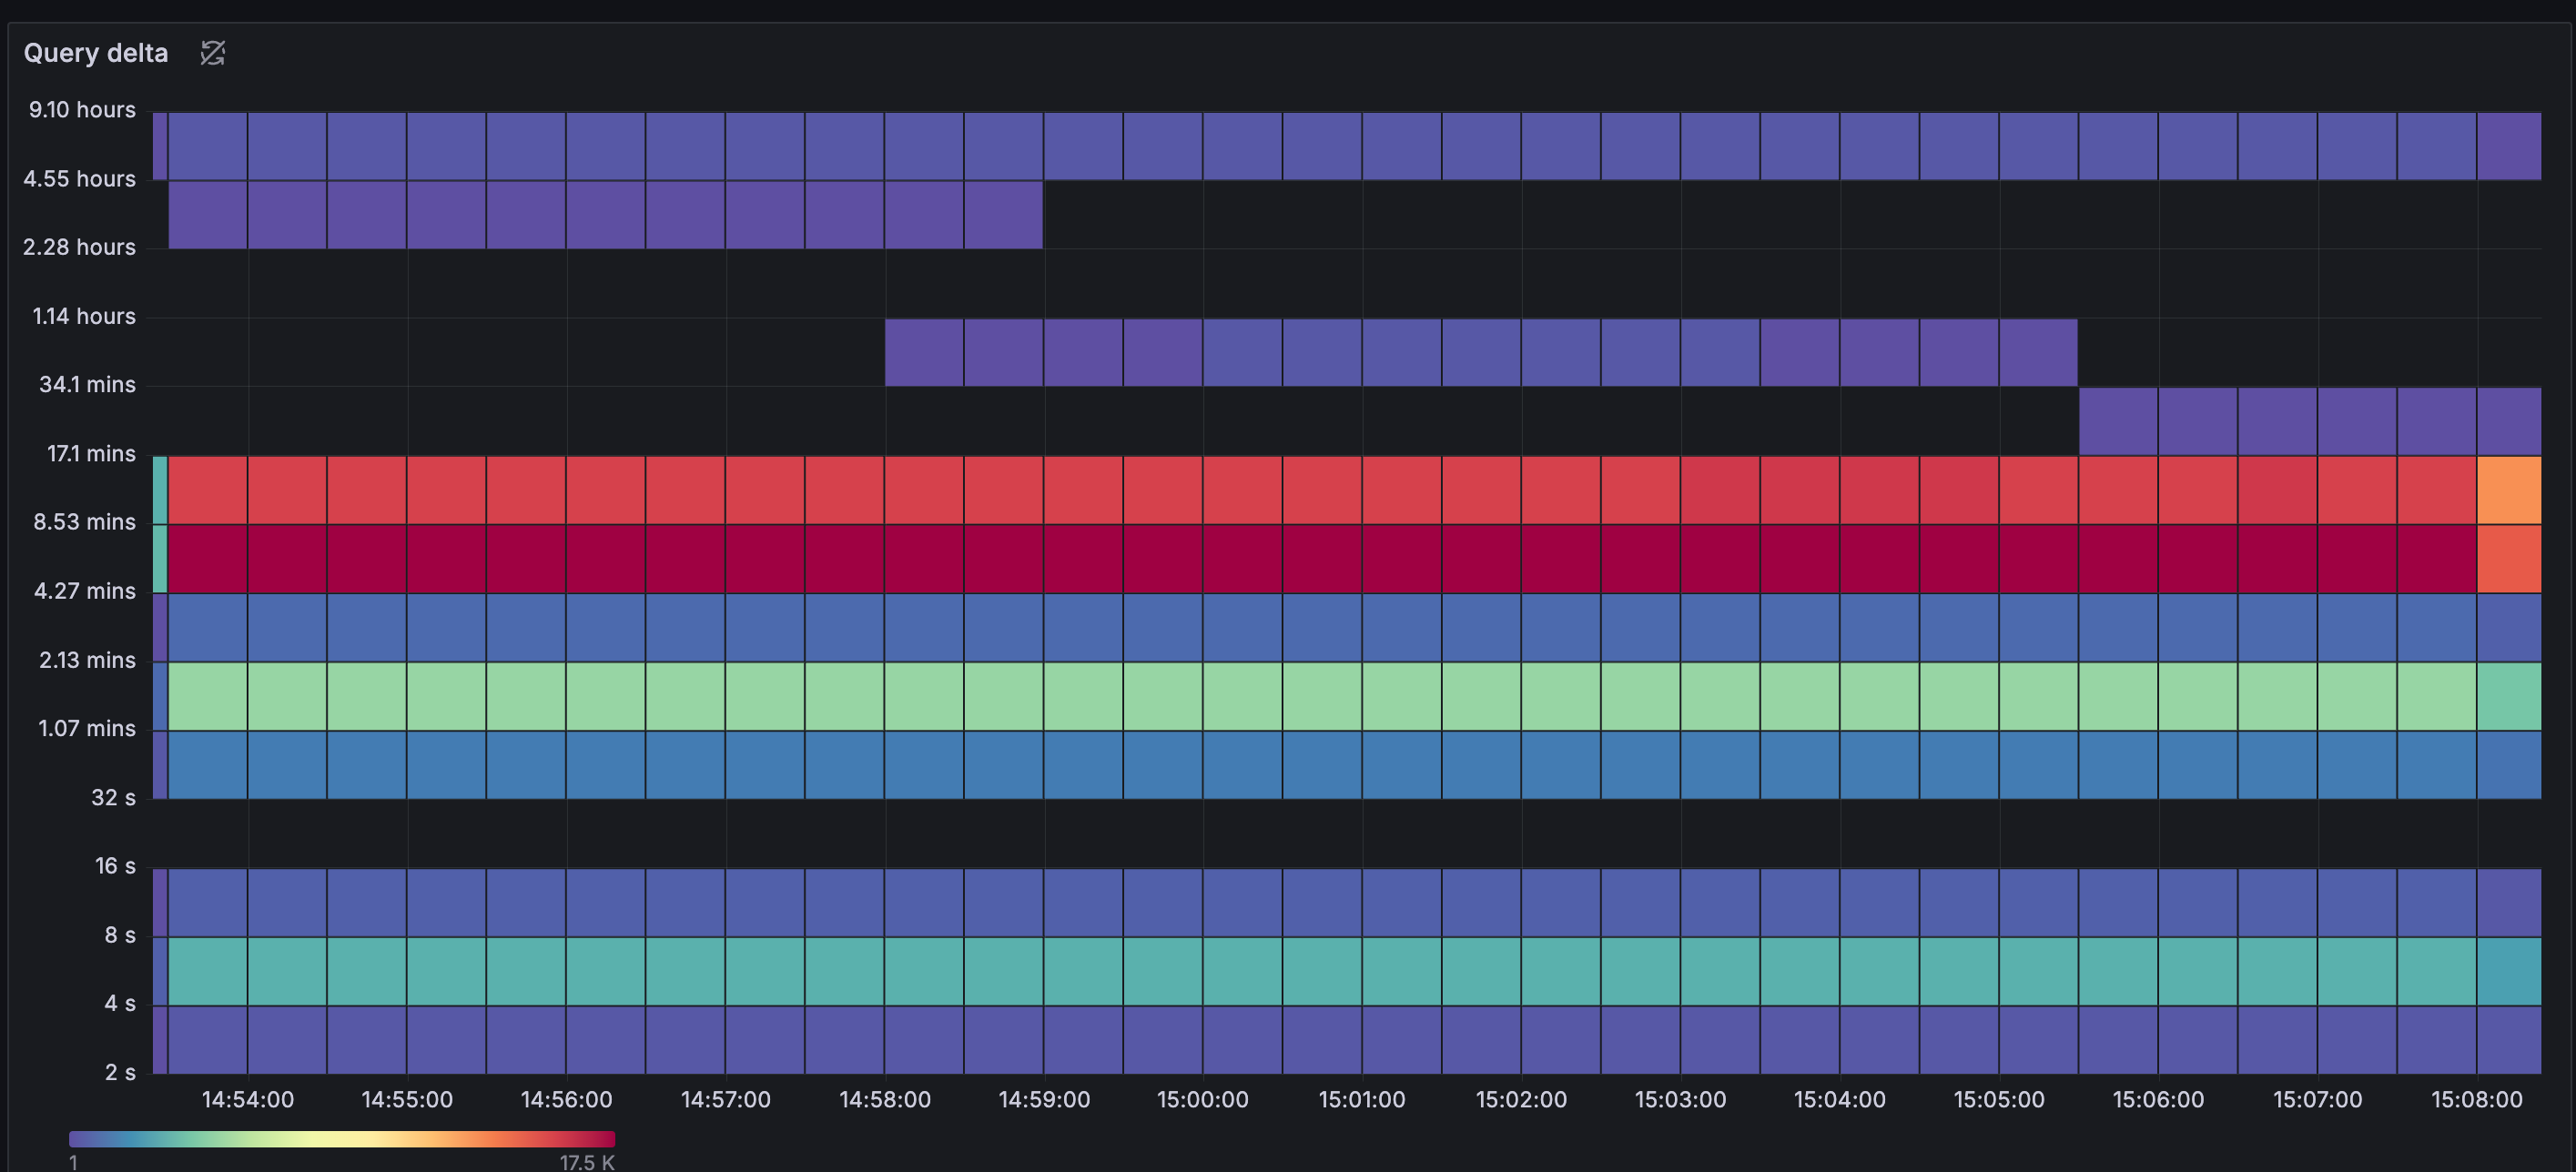
當時我們舊的Loki是使用Redis當作chunk cache,剛好目前的grafana/loki helm chart已經針對Memcached有良好封裝,我們決定直接為新的Loki套用這些設定。然而,我們發現結果不如預期。
利用前述的LogQL語法,我們發現querier花了30%以上的時間在store phase,而且我們特別新增的cache phase比率不到50%,這代表我們不僅花費時間在等待chunk下載,而且在cache以及object storage都耗費了大量時間。這與我們預期的接近100% cache phase比率及極少的store phase比率大相徑庭。
在開啟Loki的Jaeger tracing功能以後,我們發現querier光是拿chunk cache花了超過10s,再加上execution phase所花費時間,經常會遇到timeout問題。
我們最終很幸運地在memcached官方GitHub找到解方,以下是官方建議的memcached設定:
讓ingester.chunk-target-size 以及在memcached的max item size (-I參數)不要太大,可以設定成2MB,同時在memcached加上extstore特別的參數。
 memcached -m 6000 -I 2m \
	-o ext_path=/disk/extstore:500G,ext_wbuf_size=32,ext_threads=10,ext_max_sleep=10000,slab_automove_freeratio=0.10,ext_recache_rate=0
另外在loki設定中,應設定不大的batch size及parallelism,並且拉高timeout。
store.chunks-cache.memcached.batchsize意思是memcached client一次拿多少個memcached keys,可以設定成memcached server的2倍數量。store.chunks-cache.memcached.parallelism目的是同時有多少的go routine是取得memcached keys,盡可能設定愈低的值,但如果網路頻寬允許的話可以拉高。store.chunks-cache.memcached.timeout的時間包含memcached拿cache,以及serialization的時間,如果chunk的item size一大,或是batch size大的話會影響timeout時間。預設是100ms但強烈建議調整成較高的值例如60s。
Loki’s memcache client timeout is measuring the amount of time to fetch and read and process the entire batch of keys from each host.
store.background.write-back-concurrency代表寫入memcached的go routine數量,建議調整成1,避免太積極地寫入memcached,造成一些item被evict。
chunk_store_config:
chunk_cache_config:
  memcached:
    batch_size: 3
    parallelism: 2
  memcached_client:
    addresses: 127.0.0.1:11211
    timeout: 60s
  background:
    writeback_goroutines: 1
    writeback_buffer: 1000
    writeback_size_limit: 500MB
成果
Write performance
在下圖中,可以看到因為ingester在寫入log效能足夠,搭配適當的調節distributor的rate limit以及shard-streams,讓Loki不再因為rate limit問題,在distributor端拋棄送進來的log。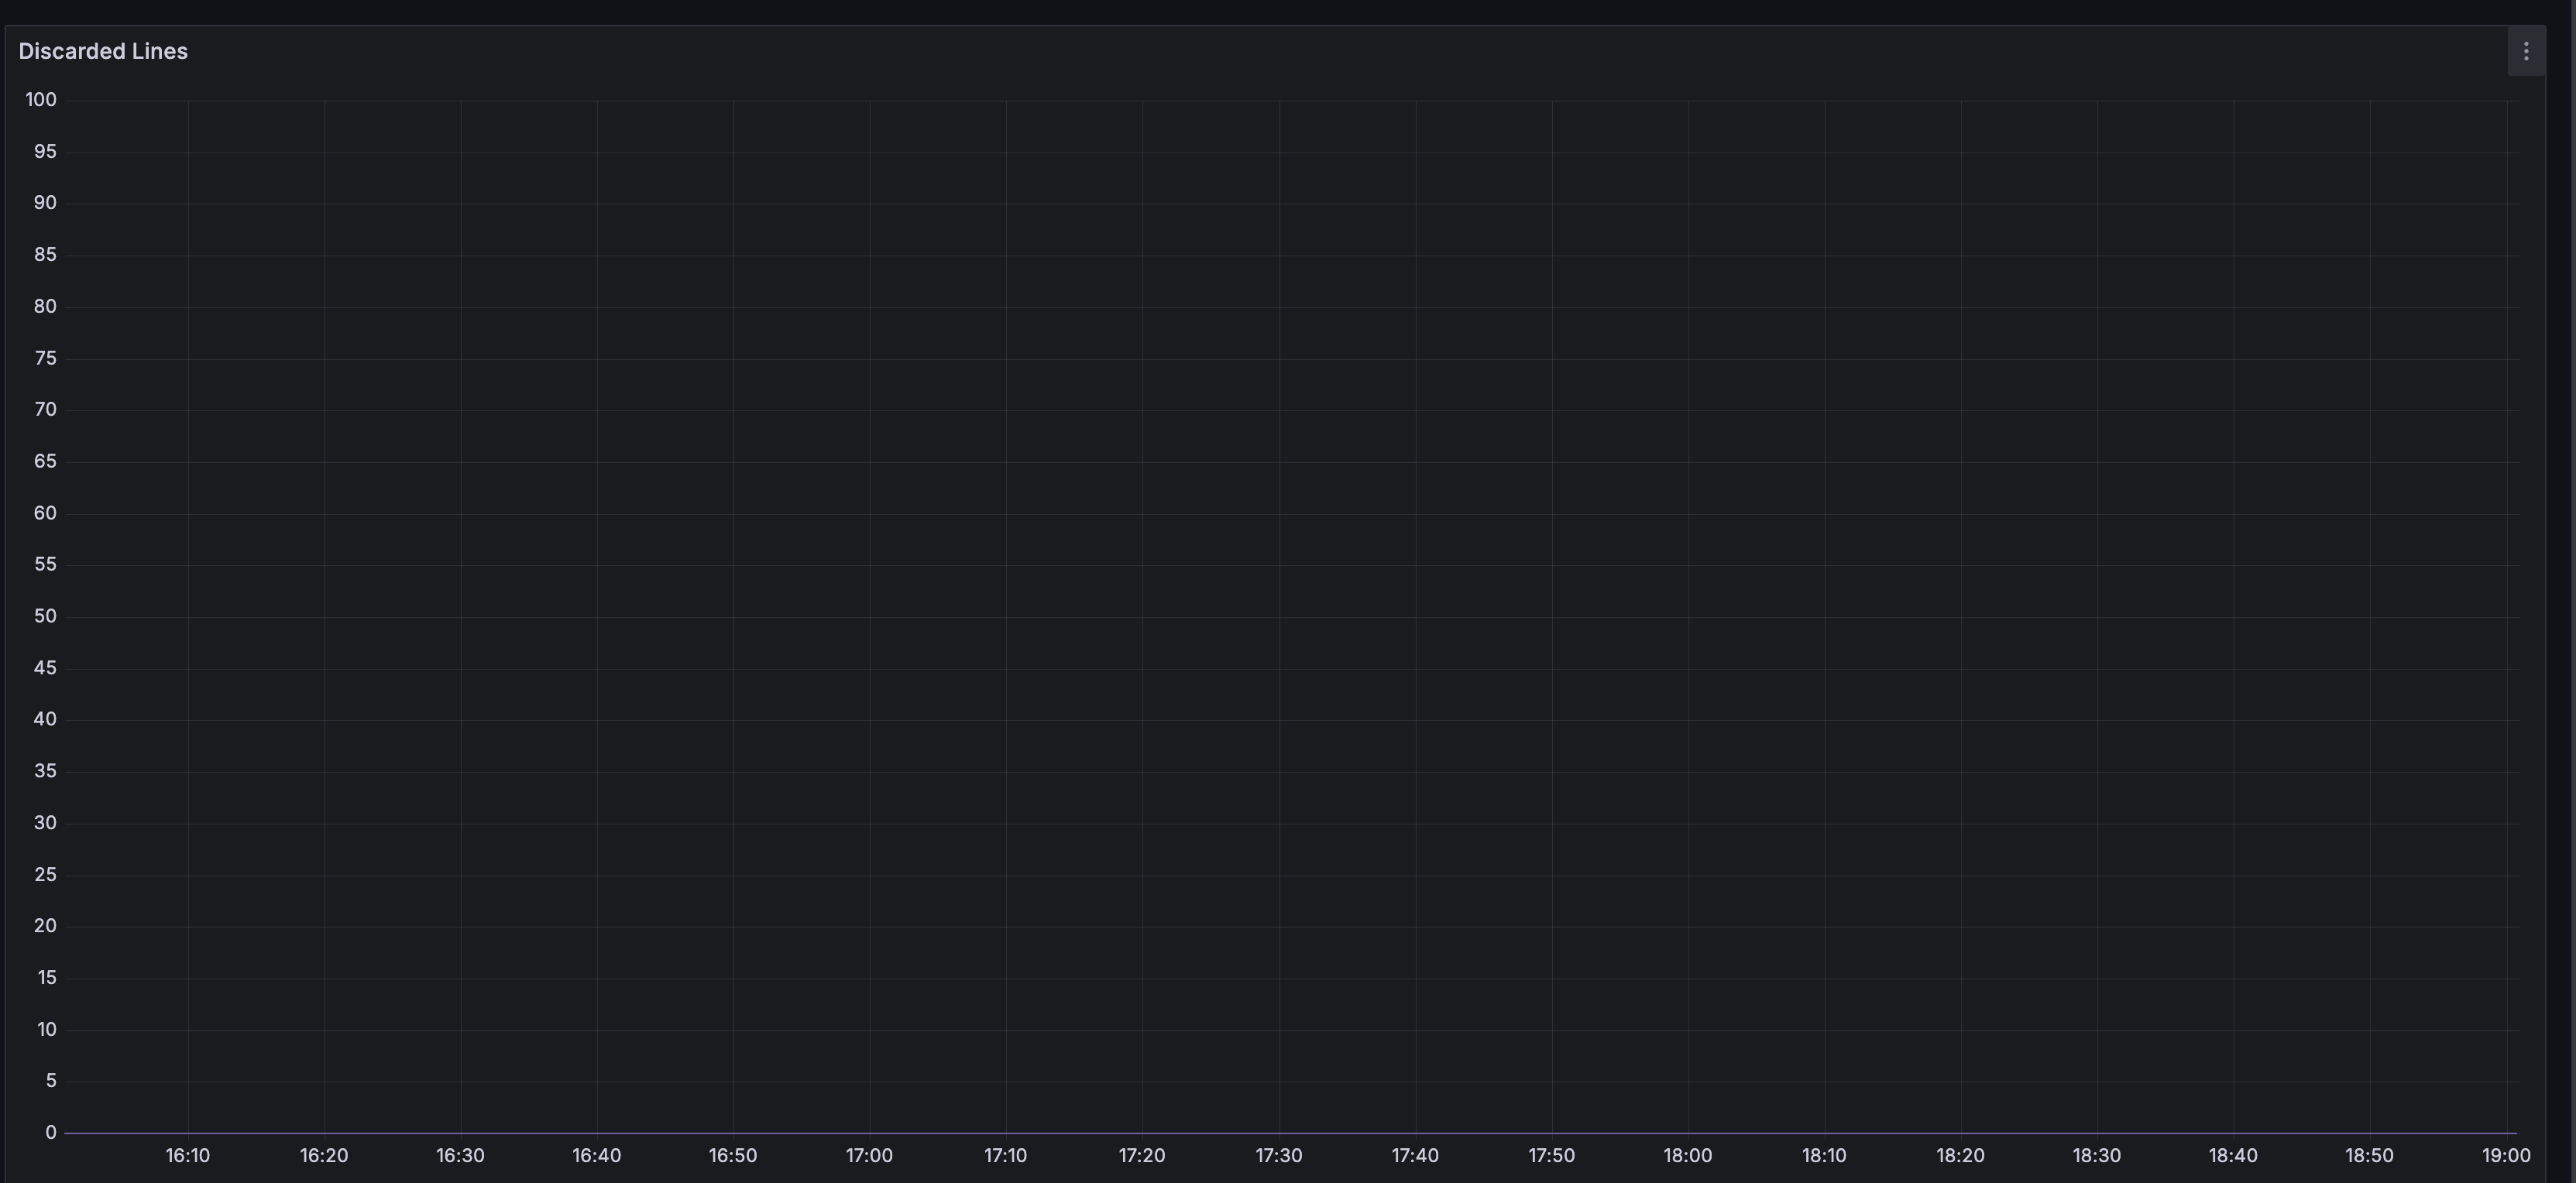
Query performance
下圖是在前面的介紹到修改過後的官方LogQL執行結果,可以看到就算是slow subquery的執行,在execution phase執行時間佔比還是高達90%以上,而且在cache部分的佔比,更高達95%以上,這印證了chunk主要從cache中拿到,省下來的時間可以執行計算LogQL最後結果。
事實上在execution phase還有調整的空間,有機會透過增加querier replicas數量、調升CPU資源或是改善LogQL語法來更近一步加速搜尋時間。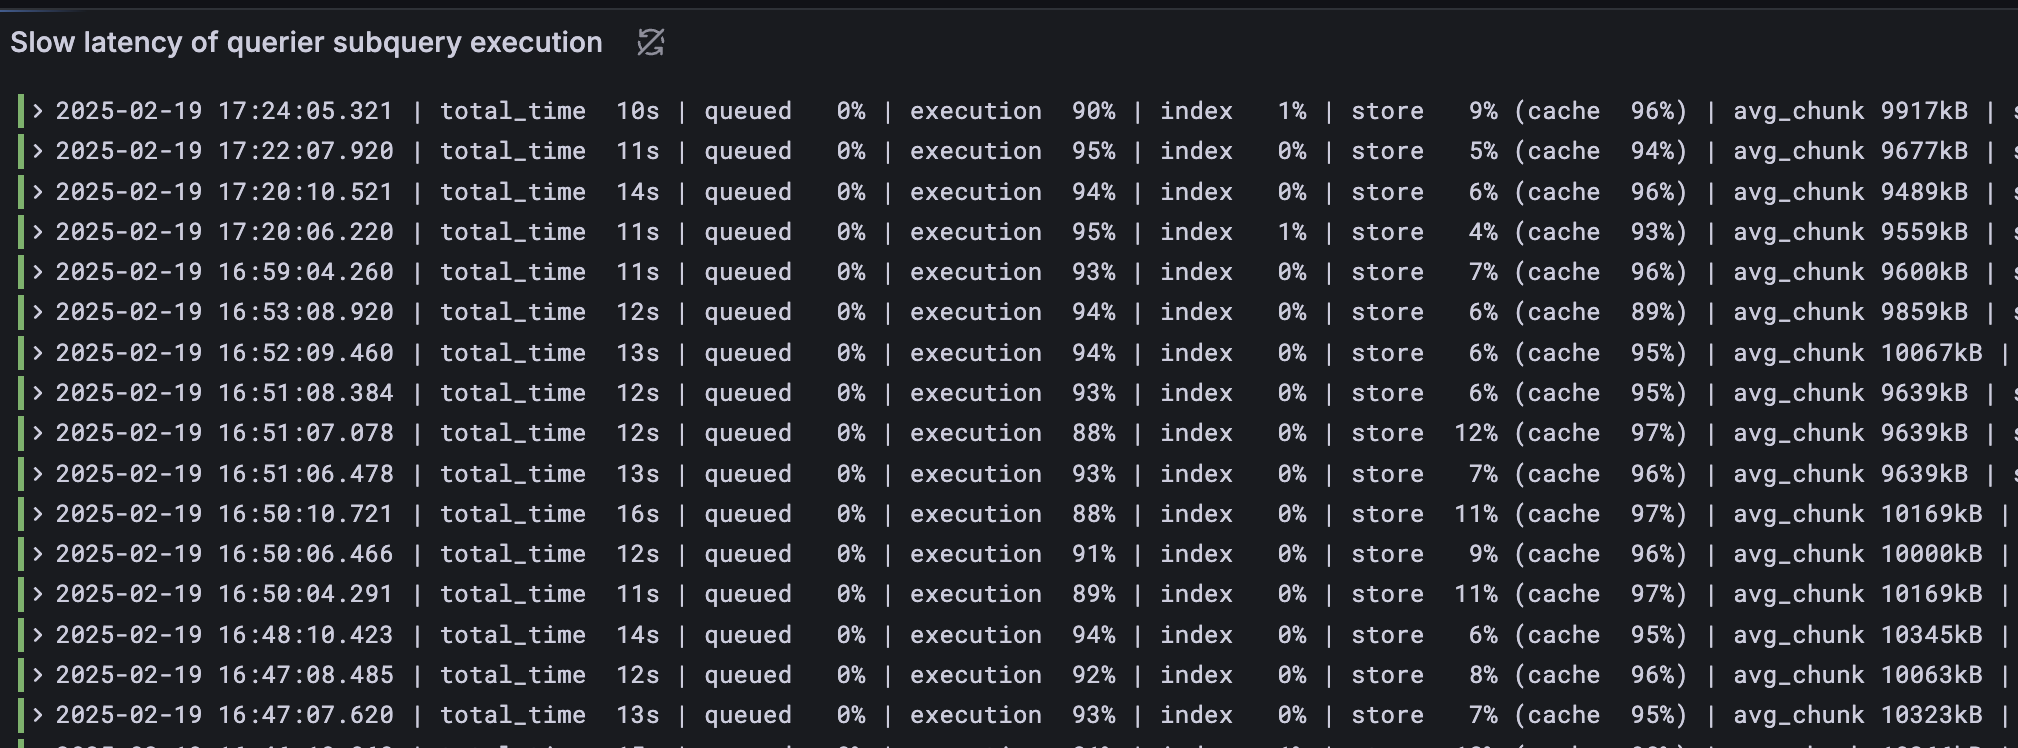
下方是query花費時間隨時間的關係圖。黃線是第99百分位、橘線是第90百分位。可以看到query時間絕大部分都少於10s。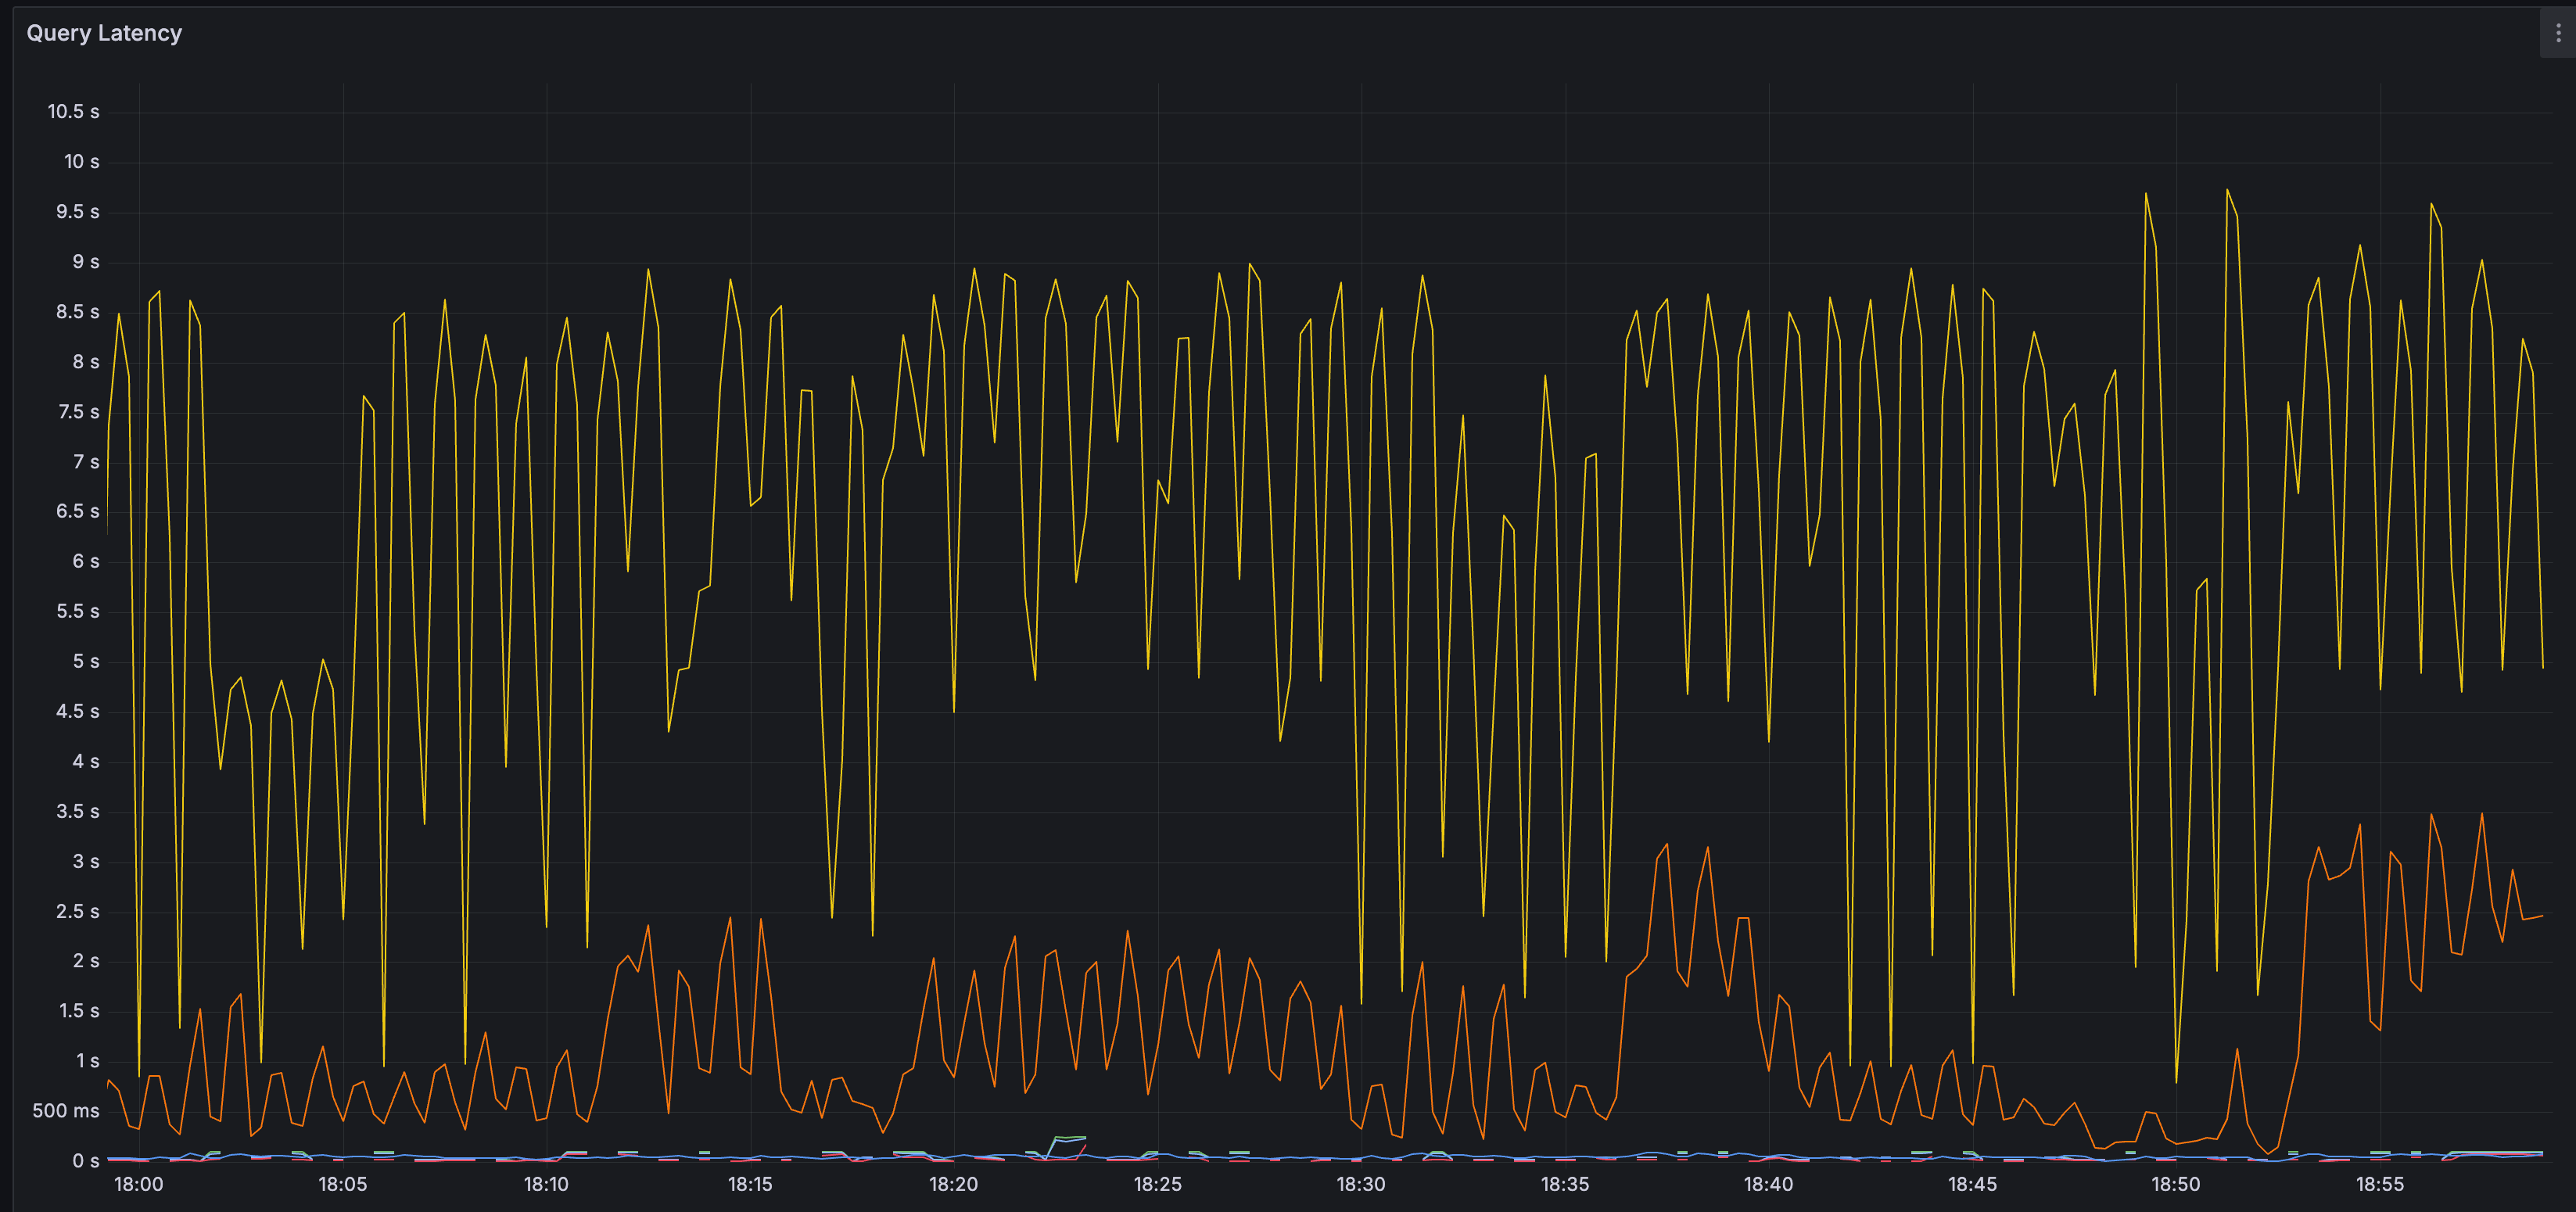
Cache performance
在chunk cache部分,hit rate大部分時間都維持70%以上,這樣Loki可以避免再向慢得多的Object Storage拿需要的chunk,也減輕Object Storage的負擔。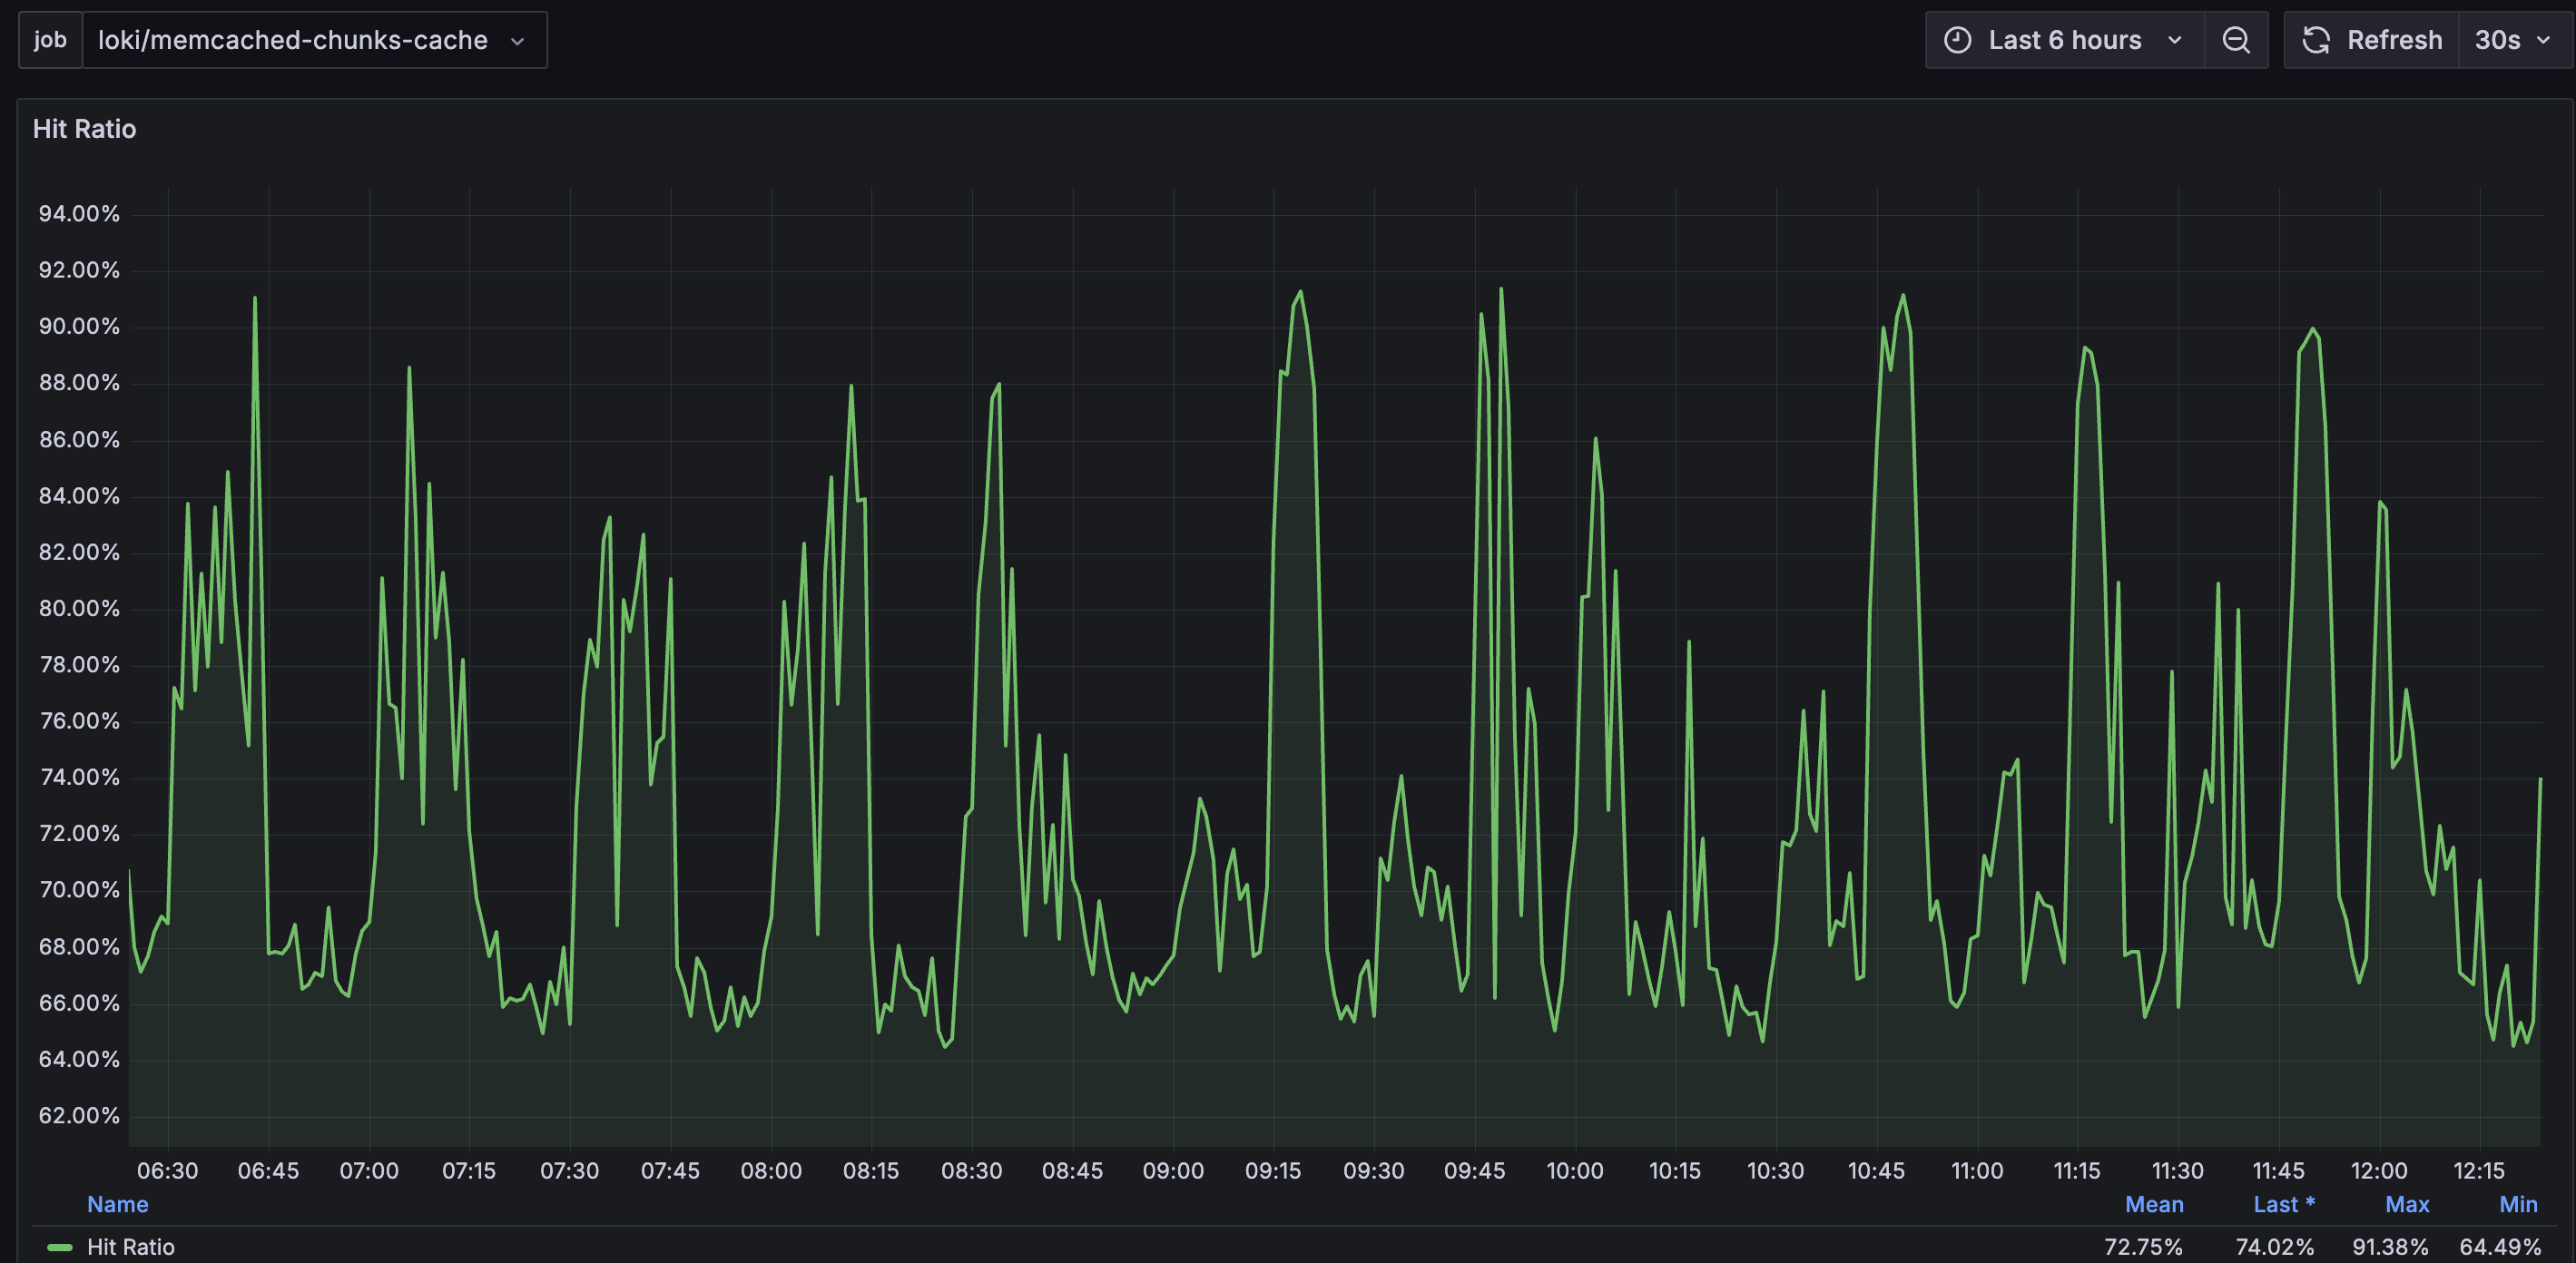
結論
在這篇文章中,我們將重點著重在Loki的config調整。先是說明為何應該優先調整寫入效能,因為會連帶影響讀取效能。再帶到在Loki中負責寫入以及讀取的component細節config設定。過程中特別感謝Grafana以及Memcached提供的技術文章,提供給我們調整上的指引。
最後的成效是在寫入時,能盡可能接收log collector送來的log,在查詢上也能充分應用cache,減少Object Storage負擔,效果是令人滿意的。我們今後也會持續針對log collector以及Loki效能做精進,提供Loki的使用者更好的使用者體驗。