This post is a follow-up to Creating a domain-specific NL-to-SQL MCP server, which introduced our MCP-based NL-to-SQL system. Here, we explore how we overcame the initial implementation's limitations through a Multi-Agent architecture.
Introduction — Why multi-agent?
While building our initial NL-to-SQL system on MCP Server, we validated a lot of possibilities. Along the way, we also discovered that a more stable and scalable architecture was clearly needed.
Limitation 1 — Automatic generation, separate execution
Our initial MCP-based NL-to-SQL system had a unidirectional connection between the LLM that generates SQL and the server that actually executes it.
The flow looked like: User question → SQL generation → Execution on a separate server → Results. While the SQL itself was generated automatically, actual execution still depended on a separate tool.
Limitation 2 — Single-point failure in a monolithic engine
The existing MCP processed everything in a single flow: Natural language interpretation → Intent generation → SQL generation → Result explanation.
This led to:
- Difficulty identifying which step caused an incorrect interpretation
- A single error cascading through the entire result
- Users struggling to understand what went wrong
Limitation 3 — Challenges in maintenance and scalability
Real-world data analysis involves various conditions and edge cases that can't be solved with simple aggregations alone. However, all rules must be packed into a single prompt in a monolithic MCP structure.
This results in:
- Prompts becoming bloated with increasing rules, raising conflict potential
- Hesitation to add new rules due to risk of affecting existing behavior
- Difficulty tracking which rules were or weren't applied
Ultimately, maintenance becomes increasingly painful as rules grow more complex.
So we built an A2A (agent-to-agent) pipeline
"From an AI that generates SQL" → "To an AI team that performs the analysis itself"
Instead of concentrating all responsibility in a single engine, we redesigned the system around specialized Agents. Each Agent collaborates step by step based on its role. We call this approach A2A (Agent-to-Agent) and implemented it using our internal AI Agent Portal (v1.4.2.4).
With the A2A architecture:
- Natural language interpretation, query generation, execution, and result explanation are connected as a seamless pipeline.
- Each step is isolated, enabling immediate identification of error sources.
- Rules are distributed across Agents, so adding new features doesn't impact existing behavior.
In other words, A2A establishes an analytics foundation with accuracy, consistency, and operational stability that was difficult to achieve with a monolithic MCP structure.
Why UTS data — Complex, but necessary
What we want to know isn't just whether a metric increased or decreased. We want to understand what actions users actually took and what flows preceded and followed those actions.
To understand this, summarized metrics alone aren't enough. We need raw event logs rich with behavioral context. This is exactly what UTS (User Tracking System) provides.
UTS is a user behavior log collection system used across various internal services:
- It records activities like feature usage, interactions, and screen navigation in a consistent event format
- Its JSON-based denormalized structure flexibly accommodates various attributes for service-specific needs
- It provides granular, multi-dimensional user behavior data including session/action-level information
Since all services share the same schema rules:
- Analysis isn't limited to a specific service
- The same data structure and pipeline can be reused when expanding analysis scope to other services
In this post, we'll use the AI Talk Suggestion service data as an example to explain our NL-to-SQL analytics system.
AI Talk Suggestion is a feature where AI suggests appropriate responses based on conversation context. Users can select suggested content at the right moment or compose their own response to send.
See official LINE guide for details.
We'll use modified example data based on actual logs for illustration purposes.
UTS-like event log example
Each row in UTS represents a single event performed by a user.
| dt | hour | user_id | session_id | view_name | event_type | event_group | event_details | client_ts | server_ts |
|---|---|---|---|---|---|---|---|---|---|
| 20251125 | 14 | usr_001 | SESS-A1 | suggestion_main | view | open | {"origin":"chat_list","mode":"default"} | 1736916000100 | 1736916000700 |
| 20251125 | 14 | usr_001 | SESS-A1 | suggestion_main | signal | suggest | {"action":"shown","item_id":"sug_101"} | 1736916000300 | 1736916000850 |
| 20251125 | 14 | usr_001 | SESS-A1 | suggestion_main | action | suggest | {"action":"selected","item_id":"sug_101"} | 1736916000450 | 1736916000920 |
| 20251125 | 14 | usr_001 | SESS-A1 | suggestion_main | action | message | {"action":"sent","content_type":"text"} | 1736916000700 | 1736916001100 |
| 20251125 | 15 | usr_002 | SESS-B2 | suggestion_main | signal | suggest | {"action":"shown","item_id":"sug_205"} | 1736916001200 | 1736916001350 |
| 20251125 | 15 | usr_002 | SESS-B2 | suggestion_main | action | suggest | {"action":"dismissed","item_id":"sug_205"} | 1736916001400 | 1736916001550 |
| 20251125 | 16 | usr_003 | SESS-C3 | settings_panel | view | settings | {"section":"ai_suggest"} | 1736916002000 | 1736916002600 |
| 20251125 | 16 | usr_003 | SESS-C3 | settings_panel | action | toggle | {"feature":"ai_suggest","value":"off"} | 1736916002450 | 1736916003000 |
For example, looking at usr_001's logs:
- Who: usr_001
- When: 2025-11-25, 14:00
- Where: suggestion_main screen
- What:
- Opened the suggestion screen from the chat list (view/open)
- AI recommendation was displayed (signal/suggest)
- Selected the recommended item (action/suggest)
- Sent a message (action/message)
Since each row captures who, when, what, and in what context, UTS serves as the core data source for granular user behavior analysis.
Foundation — Designing an NL-to-SQL data mart
While the A2A architecture improves analysis accuracy and quality, directly querying UTS data has practical limitations:
- Tables are massive (JSON-based denormalization)
- High join costs due to event-level storage
- Inevitable performance degradation if the NL-to-SQL pipeline queries raw data every time
Therefore, we built a dedicated data mart that normalizes and summarizes raw UTS for analytical purposes. By having NL-to-SQL operate on this data mart, we enabled lighter and more stable analytics execution.
LLM-friendly restructuring of raw logs
UTS contains mixed event information and JSON parameters. This makes it unstable for direct LLM interpretation. So we first extract behavioral units using rule-based logic. Then we pre-process them into semantic metrics that LLMs can directly reference.
Step 1 — Transform raw events into 'action' units
Here's a simplified example of event logs for structural explanation:
| dt | hour | user_id | event_type | event_group | event_details |
|---|---|---|---|---|---|
| 20251125 | 14 | usr_001 | signal | suggest | {"action":"shown"} |
| 20251125 | 14 | usr_001 | action | suggest | {"action":"selected"} |
| 20251125 | 14 | usr_001 | action | message | {"action":"sent","length":"24"} |
| 20251125 | 16 | usr_003 | view | settings | {"section":"ai_suggest","mode":"v2"} |
These raw events have diverse structures. This makes it difficult to determine meaningful actions directly from event type/attribute combinations.
So in the ETL stage, we transform raw events into consistent action units based on human-defined rules.
-- Step 1: Example of transforming raw events into action flags
SELECT
  dt,
  hour,
  user_id,

  /* Suggest shown flag */
  (event_type = 'signal'
   AND event_group = 'suggest'
   AND COALESCE(event_details['action'], '') = 'shown') AS is_suggest_shown,

  /* Suggest selected flag */
  (event_type = 'action'
   AND event_group = 'suggest'
   AND COALESCE(event_details['action'], '') IN ('selected','applied')) AS is_suggest_selected,

  /* Message sent flag */
  (event_type = 'action'
   AND event_group = 'message'
   AND event_details['action'] = 'sent') AS is_message_sent,

  ...
FROM raw_eventsStep 1 Result Example:
| dt | hour | user_id | is_suggest_shown | is_suggest_selected | is_message_sent | is_settings_view |
|---|---|---|---|---|---|---|
| 20251125 | 14 | usr_001 | true | false | false | false |
| 20251125 | 14 | usr_001 | false | true | false | false |
| 20251125 | 14 | usr_001 | false | false | true | false |
| 20251125 | 16 | usr_003 | false | false | false | true |
This process removes JSON parsing and conditional branching complexity. Each event becomes a clear action flag indicating which action it corresponds to.
Step 2 — Aggregate by analysis grain and pre-compute semantic metrics
Users ask questions like:
- "Users who saw AI recommendations?"
- "Users who selected recommendations?"
- "Active users who sent messages?"
To answer these, you need to combine Step 1's action flags to define concepts like "active user". However, SQL varies across questions if the LLM has to figure out this combination every time.
So in the ETL stage, we pre-aggregate by user-day (dt, user_id) and pre-compute frequently used semantic judgments as derived columns.
-- Step 2: Example of user-day aggregation and derived metric generation
SELECT
  dt,
  user_id,
  SUM(is_suggest_shown)    AS suggest_shown_cnt,
  SUM(is_suggest_selected) AS suggest_selected_cnt,
  SUM(is_message_sent)     AS message_sent_cnt,
  SUM(is_settings_view)    AS settings_view_cnt,
  -- Example AU definition: message sent OR recommendation selected
  CASE WHEN SUM(is_message_sent) > 0 OR SUM(is_suggest_selected) > 0
       THEN true ELSE false END AS is_active_user
FROM step1_events
GROUP BY dt, user_id
Step 2 Result Example:
| dt | user_id | suggest_shown_cnt | suggest_selected_cnt | message_sent_cnt | settings_view_cnt | is_active_user |
|---|---|---|---|---|---|---|
| 20251125 | usr_001 | 1 | 1 | 1 | 0 | true |
| 20251125 | usr_002 | 1 | 0 | 0 | 0 | false |
| 20251125 | usr_003 | 0 | 0 | 0 | 1 | false |
These columns directly correspond to natural language questions:
| Natural language question | Column condition for LLM |
|---|---|
| Users who saw AI recommendations? | suggest_shown_cnt > 0 |
| Users who selected recommendations? | suggest_selected_cnt > 0 |
| Active users who sent messages? | is_active_user = true |
Pre-processing aggregation and semantic calculation in ETL and exposing clear columns to the LLM enables stable and consistent SQL generation.
Domain-specific analytics data marts
User behavior within a service is recorded across multiple UTS tables spanning recommendation usage, screen navigation, settings, and more.
Based on this organized behavioral unit data, we configured domain-specific data marts. These marts quickly answer frequently asked questions in each area.
Each mart contains only the tables and columns needed for specific analytics domains. This enables the LLM to quickly find the right table and right column for each question type.
The example below uses simplified names and columns unrelated to the actual structure.

| Question type | Reference mart | Key columns |
|---|---|---|
| AU, recommendation selection rate | Suggestion Domain mart | is_active_user, suggest_selected_cnt |
| Screen dwell time | View Domain mart | avg_stay_time, view_entries |
| Settings change status | Settings Domain mart | ai_suggest_enabled, toggle_change_cnt |
Real-world example
User Question:
"How many AU yesterday?"
The LLM recognizes the question is about active users (AU) and finds the is_active_user column from the Suggestion Domain mart to generate SQL:
SELECT COUNT(DISTINCT user_id) AS au_count
FROM suggestion_domain_mart
WHERE dt = '20251125'
  AND is_active_user = true
If we queried Raw UTS directly:
-- Complex query difficult for LLM to generate
SELECT COUNT(DISTINCT user_id)
FROM uts_raw_events
WHERE dt = '20251125'
  AND (
    (event_type = 'action' AND event_group = 'message'
     AND JSON_EXTRACT_SCALAR(event_details, '$.action') = 'sent')
    OR
    (event_type = 'action' AND event_group = 'suggest'
     AND JSON_EXTRACT_SCALAR(event_details, '$.action') = 'selected')
  )
Thanks to domain-specific marts, the LLM can quickly determine which table to look at and which column to use, generating accurate SQL.
A2A architecture — 5-agent collaborative pipeline
The data marts designed earlier provide an LLM-friendly structure, but the process of converting natural language questions into accurate SQL and executing them remains complex.
- Various user expressions must be interpreted consistently
- Invalid queries must be validated before execution
- Results must be explained in a user-understandable format
A2A is designed as a structure where 5 specialized Agents with clear roles collaborate step by step. By separating each stage (natural language interpretation, Intent generation, SQL generation/validation, execution, and result explanation), responsibilities become clear. Error tracing and maintenance also become easier.
Pipeline overview

The diagram above shows how the question "How many AU yesterday?" is processed.
Core Flow:
- Dialogue: Determine question type → Analytics question
- Interpret: "yesterday" → date, "AU" → normalized to KPI-AU
- Precheck: Intent → SQL conversion and validation
- Execute: Execute on Presto → Return results
- Present: Generate user-friendly response
Each Agent has clear inputs and outputs, operating as a pipeline where the previous stage's output becomes the next stage's input.
Role of each agent
1) Dialogue agent — Conversation entry point and router
Role
The entry point for all user input and the traffic controller that determines routing based on question type.
if   analytics question     → route to Interpret     # "How many AU by Segment on 2025-11-30?"
elif follow-up question     → respond directly       # "Convert results to percentage"
else                        → respond directly       # "Hello", "What can you do?"
Output
- General conversation / follow-up → Conversational response shown directly to user
- Analytics request → Refined question + context for Interpret to use
2) Interpret agent — Natural language to structured intent
Role
Normalizes various natural language expressions into structured Intent JSON. The NL-to-SQL pipeline can directly understand this format. The key point is that this isn't simple keyword matching but Semantic Matching.
NL → Metric normalization
For example, these questions can all mean the same thing:
- "How many AU?"
- "Tell me the active user count"
- "Number of active users"
Interpret normalizes all of these to the same Metric Key (KPI-AU).
Internally, it references a Metric Ontology (example):
KPI-AU:
  synonyms: ["active users", "AU", "active user count"]
  definition: "Users who sent at least one message or selected an AI recommendation"
  table: suggestion_domain_mart
  logic: "is_active_user = true"
  dt_required: true
Output
It combines normalized Metric, date, and additional conditions into Intent JSON. The next stage (Precheck) can use this directly. Example:
{
  "metric_key": "KPI-AU",
  "dt": "20251125",
  "table": "suggestion_domain_mart",
  "aux_tables": [],
  "notes": []
}
3) Precheck agent — Intent → Safe SQL generation
Role
Based on the Intent JSON from Interpret:
- Performs basic safety and validity checks using predefined Guardrail rules
- Generates a single Presto SELECT statement using the template registry
Template selection
Selects the appropriate SQL template based on Intent's metric_key:
KPI-AU→ AU aggregation templateKPI-RETENTION-D1→ D+1 retention templateSEG-RETENTION-D1→ Segmented D+1 retention template
It then incorporates date range (dt_from, dt_to), target table, and other conditions to complete the final SQL.
Guardrail validation
Validates basic safety before SQL generation:
- Date format verification
- Only allowed tables are used
- Query is SELECT-only, etc.
Output
If validation passes, it populates the template with date range, table name, etc. to complete the final SQL:
-- Precheck output example
-- Summary: AU for 2025-11-25

SELECT
  COUNT(DISTINCT CASE WHEN is_active_user THEN user_id END) AS au_count
FROM suggestion_domain_mart
WHERE dt = '20251125'
4) Execute agent — SQL execution
Role
Directly passes the single SELECT statement from Precheck to the internal Presto-based execution environment.
Processing
-
Query execution
-
Timeout management, etc.
Output
Normalizes execution results to JSON format for Present:
{
  "type": "EXECUTE_RESULT",
  "data": [
    {"au": 99999}
  ],
  "metadata": {
    "row_count": 1,
    "execution_time_ms": 30
  }
}
5) Present agent — Result interpretation + user-friendly summary
Role
Receives Execute results (JSON) and creates the final text/table response to show users.
Processing
Present composes the final response:
- Metric Definition — Explains the meaning of the requested metric
- Result Summary — Organizes data in an easy-to-read format
Output
Example final user response:
📊 AU (Active Users): Users who sent at least one message or selected an AI recommendation per day

As of 2025-11-25, AU is 99,999.
This 5-stage pipeline (Dialogue → Interpret → Precheck → Execute → Present) operates sequentially within a single session while maintaining context. Therefore, the same question always generates the same SQL and the same results, guaranteeing consistent NL-to-SQL analytics.
Agent collaboration: Round robin vs swarm
Since NL-to-SQL requires different processing steps for each user question, the Agent execution method significantly impacts overall performance and user experience.
To find the optimal orchestration strategy, we evaluated two multi-agent architectures provided by our internal AI Agent Portal (v1.4.2.4): Round Robin and Swarm. We selected these two structures as practical candidates for our analytics Agents. Round Robin executes Agents in a fixed cycle, while Swarm uses dynamic handoff-based collaboration between Agents. These patterns are widely used in multi-agent orchestration, but their behavior may differ across implementations.
Early evaluations suggested that Swarm was a better fit for conversational NL-to-SQL. The sections below outline what we observed in our analytics scenario.
Overall flow comparison
The differences between the two architectures became clearer when we compared how they handled common types of user questions. The diagram below shows how each question type moves through the pipeline.
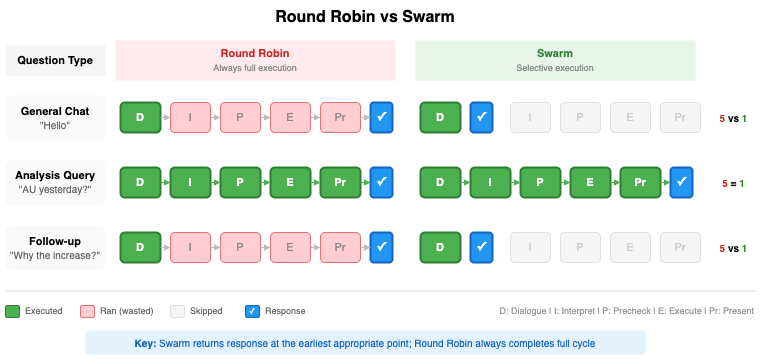
| User question | Round robin | Swarm |
|---|---|---|
| "Hello" | Executes all 5 Agents | Executes only 1 Agent (Dialogue) → Immediate response |
| "AU yesterday?" | Executes all 5 Agents | Executes all 5 Agents |
| "Why did it increase?" (follow-up) | Executes all 5 Agents | Executes only 1 Agent (Dialogue) → Context-based immediate response |
In Round Robin, every question triggers the full pipeline. In Swarm, only the Agents needed for a given question join the execution path.
Characteristics of each approach
Based on AI Agent Portal v1.4.2.4 implementation
Round robin — Fixed order full execution
| Aspect | Description |
|---|---|
| Execution Strategy | Always sequential D → I → P → E → Pr |
| Advantages | Simple implementation, predictable behavior |
| Disadvantages | Later Agents still run even when not needed |
Round Robin suits pipelines where every step should always run and conversational overhead is less critical.
Swarm — Rule-based selective execution
| Aspect | Description |
|---|---|
| Execution Strategy | Dialogue determines question type, handoff only when needed |
| Advantages | Fewer Agent calls possible, shorter response time |
| Disadvantages | Additional handoff rule design required |
Swarm is better suited to interactive scenarios that involve both conversational and analytical requests.
Swarm's routing rules:
In our Swarm setup, each question type follows a dedicated route through the Agents:
| Question type | Handling | Executed agents |
|---|---|---|
| General Chat | Immediate response | Dialogue |
| Analysis Query | Full pipeline | D → I → P → E → Pr |
| Follow-up | Context-based response | Dialogue |
Only analysis queries traverse the full five-Agent pipeline. Short conversational turns stay within the Dialogue Agent.
Summary
Round Robin and Swarm each offer different trade-offs for multi-agent orchestration. Round Robin processes every step in a fixed sequence. Swarm activates only the Agents needed for each question. In our tests, this selective execution made Swarm more effective for conversational NL-to-SQL.
Key innovations
The core of the A2A architecture described above can be summarized in three points.
Innovation 1 — Precise context injection by role
Each Agent in A2A receives only context optimized for its role.
| Agent | Specialized context injected |
|---|---|
| Dialogue | Conversation context, follow-up rules |
| Interpret | Metric Ontology, date rules, template routing |
| Precheck | SQL templates, Guardrail policies, schema info |
| Execute | Presto execution |
| Present | Execute results, result interpretation |
Why this matters
MCP required all rules in a single prompt:
- Natural language interpretation rules
- Schema information
- SQL templates
- Guardrail policies
- Result format rules

→ Hundreds of lines of prompts with high rule conflict potential
A2A provides only the specialized knowledge needed to each Agent. This results in:
- Maximized LLM performance — Focus on relevant information only
- Rule conflict prevention — Each Agent is independent
- Easier maintenance — Modifying one Agent doesn't affect others
Innovation 2 — Structured agent interface
A2A's core innovation is that Agents exchange structured data.
Structured JSON exchange
[Interpret → Precheck]
{
  "metric_key": "KPI-AU",
  "dt_from": "20251125",
  "table": "suggestion_domain_mart"
}

[Precheck → Execute]
{
  "sql": "SELECT COUNT(...)"
}
This always guarantees the same structure and ensures type safety.
Practical effects
Thanks to structured interfaces, A2A guarantees:
- Consistency — The same question always generates the same Intent. "How many AU yesterday?" always converts to
{metric_key: "KPI-AU", dt: "20251125"}regardless of when asked, which always generates the same SQL. - Stability — Each Agent can trust the data format sent by the next Agent. Precheck is confident Interpret will always provide
metric_key, and Execute is confident Precheck only sends validated SQL.
Innovation 3 — Failure isolation by stage
A2A executes and logs each stage independently, enabling immediate identification of what went wrong and where.
Stage-by-stage failure handling
| Stage | Behavior on failure | Meaning |
|---|---|---|
| Interpret | metric_key: unknown | Natural language intent interpretation failed |
| Precheck | PRECHECK_STOP | Policy/schema violation |
| Execute | empty result | Execution error |
| Present | Empty result handling | Upstream error propagation |
Practical effects
Stage-by-stage error isolation and tracing is now possible. A2A can evolve into an analytics platform that operates robustly even in real production environments.
Specialize, standardize, isolate. These three principles shaped a pipeline that's both debuggable and extensible.
Conclusion
From MCP to A2A — What we learned
Here are the lessons from this journey:
| Stage | What we learned |
|---|---|
| MCP (Monolithic) |
Works well for simple schemas or small data volumes, where a monolithic prompt-based architecture can be sufficient. |
| A2A (Multi-Agent) |
Provides clearer separation of responsibilities through specialized Agents and makes debugging and rule management more predictable. |
Key Takeaway: Simpler workloads fit monolithic designs, while evolving analytical demands require collaboration across specialized Agents.
This structure enables clearer responsibilities, more predictable execution, and safer growth as NL-to-SQL workflows become more complex.
The next chapter: Evolving A2A in real use
A2A at this point is still in its early form, with some constraints:
- Designed around defined question sets — Completely new pattern free-form queries aren't yet supported.
- Static prompt management — User patterns or failure cases aren't automatically reflected.
These constraints aren't A2A's limitations, but starting points for the next stage.
NL-to-SQL isn't simply about converting questions to SQL. It's about designing an entire experience. This experience accurately understands user intent and computes metrics based on shared business definitions. It also delivers trustworthy results in a consistent way.
A2A is one approach to building that experience—and it's still evolving. What comes next will be shaped by real-world usage.
🚀 Stay tuned for Part 3: A2A in Production