In a previous article, Measuring voice quality in the LINE app, we introduced how the LINE app adapts to changes in acoustic, network, and global environments. Specifically, we detailed the method for measuring AEC (acoustic echo cancellation) performance. In this article, we will introduce how to measure the performance of noise suppression (NS) technology, which is a key element in adapting to acoustic environments.
Introduction to NS technology - What is NS?
Sound is transmitted as a wave vibrating through the air, and a microphone is a device that converts these sound waves into electrical signals. However, microphones capture all sounds in the surrounding environment during voice calls, including background noise as well as the user's voice. Therefore, the signal captured by the microphone contains both the user's voice and background noise, which can degrade call quality.
NS is a technology that removes background noise from the surrounding environment to provide users with cleaner and higher-quality voice calls. Since it is impossible to create a perfectly quiet environment without any noise, the noise problem must be solved through NS technology. NS technology helps users make clear voice calls in various environments, which is a key element of the LINE app user experience.
We have developed our own NS technology and introduced machine learning to provide high-quality noise suppression performance. This allows users to enjoy clean and high-quality voice calls with minimal inconvenience from background noise.
How to measure NS performance
Quantitative evaluation is an important method for objectively measuring and evaluating the performance of NS technology. Through quantitative evaluation, we can reliably understand the noise suppression capability of the technology and continuously improve the user's call experience.
The two most important factors when evaluating the performance of NS technology are maintaining audio quality and measuring noise suppression capability. This means evaluating how well the technology preserves desired sounds, such as the user's voice, while reducing background noise.
We effectively manage the NS function through quantitative evaluation and continue to strive to provide the best call experience to our users. The performance measurement of NS technology is carried out through the following procedures.
- Establishing a performance measurement approach
- Selecting a dataset
- Preparing the test dataset
- Selecting NS performance evaluation metrics
- Configuring the measurement system environment
- Measuring NS performance
Let's look at each procedure in order.
Establishing a performance measurement approach
The approach established to measure NS performance is as follows.
Ensuring reproducibility and consistency
We use standardized evaluation tools to measure performance in a repeatable environment. We also conduct tests in a local environment using the same dataset to minimize the impact of the network. This allows us to obtain consistent results under the same conditions and accurately identify changes or improvements in NS technology performance.
Reliable evaluation metrics
We use internationally recognized evaluation standards to derive reliable performance metrics widely accepted in the industry and academia. By deriving metrics that indicate the clarity of speech and the effectiveness of noise suppression, we can ensure the reliability of NS technology performance and set development directions by quantitatively comparing product performance.
Confirming performance in various noise environments
To quantitatively confirm the performance of NS technology in various environments, we measure performance as follows.
- Large-scale voice dataset: We use a voice dataset that includes numerous voice samples considering elements such as gender or age.
- Various types of noise: We use a noise dataset that includes noise from various environments such as cafes, roads, and offices.
- Adjusting synthesis ratio: To enhance the stability of NS technology, we test by combining the original voice and noise in various ratios.
We then verify how effectively NS technology works in various environments using this approach and aim to provide users with the best voice call experience.
Selecting a dataset
Our goal is to evaluate the performance of NS technology across all audible frequency ranges. To achieve this, we selected high-resolution audio with a sampling rate of 48kHz as the dataset. Audio with a sampling rate of 48kHz can comprehensively capture sounds in the human audible frequency range, approximately 20Hz to 20kHz, allowing us to precisely evaluate how NS technology works across various frequencies.
Additionally, we selected noise data consisting of 18 different scenes. Each scene was recorded in different locations, which is an important factor in evaluating how NS technology works differently depending on the user's location and environment. Since the user's actual environment is very diverse, we use data recorded in various scenes and locations to verify whether the technology can effectively suppress noise in these diverse environments.
Finally, to derive reliable evaluation results, a sufficient amount of audio data is necessary. Including various audio sources allows us to obtain statistically significant results, verifying the consistent performance of NS technology and identifying performance degradation in exceptional cases or specific conditions.
Considering these factors, we selected a noise dataset that includes high-resolution 48kHz audio and 18 scenes recorded in various environments.
Group A: Voice dataset
For the voice dataset, we use English data from the multilingual interpretation data hosted on AI Hub, which is a website partly operated by Korea's National Information Society Agency.
- Original source: 다국어 통·번역 낭독체 데이터 (Multilingual interpretation data, in Korean only)
- Dataset name: "Validation - 원천 데이터 - VS_en_1" (total 17,981)
- Format
- Sampling rate: 48kHz
Group B: Noise dataset
For the noise dataset, we use the DEMAND dataset.
- Original source: DEMAND: a collection of multi-channel recordings of acoustic noise in diverse environments
- Types of noise
- Consists of 18 scenes
- Each scene has 16 channels (recorded simultaneously from different locations)
- Format
- Sampling rate: 48kHz
- Length: 5 minutes
The table below shows the noise scenes included in the Demand dataset. There are six main categories, each consisting of three scenes.
| Category | Scene | Description |
|---|---|---|
| Residential | Washing | Laundry room with a running washing machine |
| Kitchen | Kitchen preparing food | |
| Living | Living room with music playing | |
| Nature | Field | Sports field |
| River | Stream with flowing water | |
| Park | Park with many tourists | |
| Office | Office | Office with three people using computers |
| Hallway | Hallway in an office building with people passing by | |
| Meeting | Meeting room in discussion | |
| Public | Station | Subway transfer area |
| Cafeteria | Busy office cafeteria | |
| Restaurant | University cafeteria during lunch | |
| Street | Traffic | Busy traffic intersection |
| P Square | Public square with many tourists | |
| Cafe | Cafeteria in a public square | |
| Transportation | Metro | Subway |
| Bus | Bus | |
| Car | Private car |
Preparing the test dataset
The test dataset is created by mixing voice data and noise data to achieve a predefined signal-to-noise ratio (SNR) and level of the mixed signal.
Using this prepared dataset, we can precisely evaluate the performance of NS technology in various noise environments and objectively assess its performance in real-world usage scenarios.
Test dataset A: Files with clean voice
Randomly select 3,780 voice data samples from Group A without duplication.
Test dataset B: Noise files
Randomly select 3,780 noise data samples from Group B (16 channels * 18 scenes).
Test dataset C: Files mixing test datasets A and B
The process of creating test dataset C focuses on simulating a test dataset that mimics real-world usage scenarios by mixing test datasets A and B. Variables that play an important role in real-world usage scenarios include the distance between the speaker and the microphone, the speaker's voice volume, and the location of the noise source. These variables directly affect the level and SNR settings as follows.
- Distance between the speaker and the microphone: The farther the distance between the speaker and the microphone, the lower the recorded voice level.
- Speaker's voice volume: The louder the speaker's voice, the higher the recorded voice level. Conversely, the lower the speaker's voice, the lower the level.
- Location and nature of the noise source: The location and nature of the noise source (for example, small and constant noise, loud and intermittent noise) significantly affect the SNR. The closer the noise source is to the microphone or the louder the noise, the lower the SNR. This means that the strength of the voice signal relative to the noise is lower.
The level and SNR are determined by the above variables, and they are important factors in evaluating the audio quality of the mixed audio data and the performance of noise suppression technology. The level determines the overall volume of the audio data, and the SNR represents the ratio of the voice signal to the noise, which is used to evaluate how effectively the noise suppression technology can remove noise.
Considering these variables, we set various level and SNR conditions to create test dataset C that can cover various scenarios that may occur in real-world usage environments. This allows us to evaluate the performance of noise suppression technology more accurately and comprehensively.
The level is subdivided into the following stages.
- Level: -15, -20, -25, -30, -35, -40, -45 dB (total 7 stages)
A level value of -15dB means a loud sound, which indicates a loud conversation or a short distance between the speaker and the microphone. On the other hand, a level value of -45dB indicates a very quiet sound, which may correspond to a whisper in a quiet environment or a situation where the distance from the microphone is far.
The SNR is subdivided into the following stages.
- SNR: -5, 0, 5, 10, 15, 20 dB (total 6 stages)
An SNR value of -5dB indicates that the noise is louder than the voice signal. This simulates a conversation in a very noisy environment, such as near a construction site or in a noisy cafe. On the other hand, an SNR value of 20dB indicates that the voice signal is much louder than the noise. This corresponds to a situation such as a clear voice call in a relatively quiet office environment.
A total of 42 (7 level stages * 6 SNR stages) conditions are created by combining the level and SNR conditions. We create five test data samples for each condition, ensuring an even distribution of test data across all conditions. During this process, we adjust the noise data to match the length of the voice data and adjust the mixed audio data's volume to the target level for a specific SNR.
Through this process, we generate a total of 210 datasets (42 conditions * 5 data samples) for each scene. The number of datasets per SNR and level is as follows:
| Level/SNR | -5 | 0 | 5 | 10 | 15 | 20 |
|---|---|---|---|---|---|---|
| -15 | 5 | 5 | 5 | 5 | 5 | 5 |
| -20 | 5 | 5 | 5 | 5 | 5 | 5 |
| -25 | 5 | 5 | 5 | 5 | 5 | 5 |
| -30 | 5 | 5 | 5 | 5 | 5 | 5 |
| -35 | 5 | 5 | 5 | 5 | 5 | 5 |
| -40 | 5 | 5 | 5 | 5 | 5 | 5 |
| -45 | 5 | 5 | 5 | 5 | 5 | 5 |
The total number of test datasets is as follows:
- Number of scenes (18) * Number of test datasets per scene (210) = Total 3,780
This test dataset is designed to broadly reflect various situations that users may encounter in their daily lives. It simulates various noise environments in everyday life, such as at home, in the office, in a cafe, on the roadside, and in public places, by changing the level and SNR. By providing this extensive test dataset as input to the NS technology, we can comprehensively verify the performance of the NS technology and precisely evaluate how effectively it works in real-world usage environments.
Selecting NS performance evaluation metrics
At our company, we aim to consistently evaluate the performance of NS technology and increase the reliability of the results.
Generally, the ITU-T P.835 recommendation, which provides specific procedures for subjectively evaluating voice call quality in environments with background noise, is often referenced for evaluating NS technology performance. However, subjective evaluation has limitations, such as high costs and time consumption, and the results may vary depending on the evaluator's subjectivity. To address these issues, HEAD acoustics developed 3QUEST, a listening quality evaluation method designed to objectively evaluate voice call quality in environments with background noise, based on the ITU-T P.835 recommendation. This method, designated as the ETSI EG 202 396-3 standard, was developed to overcome the limitations of subjective evaluation and supports the quantitative evaluation of product performance in various noise situations. Unlike ITU-T P.835, where people directly listen and participate in the evaluation, 3QUEST uses software to evaluate the sound, ensuring consistent evaluation results for the same input.
We selected HEAD acoustics' 3QUEST as the NS evaluation tool. 3QUEST provides three objective metrics: S-MOS, N-MOS, and G-MOS.
- S-MOS: A metric that measures the quality of the preserved voice after noise suppression, expressed as a number from 1 to 5, with higher numbers indicating better voice quality.
- N-MOS: A metric that measures the amount of remaining noise after noise suppression, expressed as a number from 1 to 5, with higher numbers indicating better noise suppression quality.
- G-MOS: A comprehensive quality metric that combines S-MOS and N-MOS.
The table below summarizes the subjective evaluation methods for S-MOS, N-MOS, and G-MOS as guided by ITU-T P.835. By referring to the table below, you can understand the subjective perception of evaluators regarding speech distortion and residual noise based on the 3QUEST result metrics.
| Determination of subjective speech MOS (S-MOS) | Determination of subjective noise MOS (N-MOS) | Determination of subjective global MOS (G-MOS) |
|---|---|---|
|
Attending ONLY to the SPEECH SIGNAL, select the category which best describes the sample you just heard. 5 - NOT DISTORTED |
Attending ONLY to the BACKGROUND, select the category which best describes the sample you just heard. 5 - NOT NOTICEABLE |
Select the category which best describes the sample you just heard for purposes of everyday speech communication. 5 - EXCELLENT |
Source: HEAD acoustics Application Note
We selected two objective metrics, S-MOS and N-MOS, from 3QUEST for evaluation. We excluded G-MOS because it is a comprehensive metric for evaluating the overall call quality of the NS module, making it difficult to directly identify the impact when specific metrics need improvement. Instead, by separately evaluating S-MOS and N-MOS, we can more precisely identify and apply improvements in voice quality and noise suppression quality.
The table below allows you to experience the difference in voice quality for each S-MOS and N-MOS score range by playing the audio files.
| S-MOS | Audio file | Notes |
|---|---|---|
| 1.x | ||
| 2.x | ||
| 3.x | ||
| 4.x | Clean voice |
Contains information from VCTK Dataset which is made available under the ODC Attribution License.
| N-MOS | Audio file | Notes |
|---|---|---|
| 2.x | ||
| 3.x | ||
| 4.x | Clean voice |
Contains information from VCTK Dataset which is made available under the ODC Attribution License.
Configuring the measurement system environment
Once the test dataset configuration and evaluation metric selection are complete, we configure the measurement system environment to measure the performance of the NS module. The components are as follows.
- Test dataset: Test dataset A (voice data), Test dataset B (noise data), Test dataset C (mixed data)
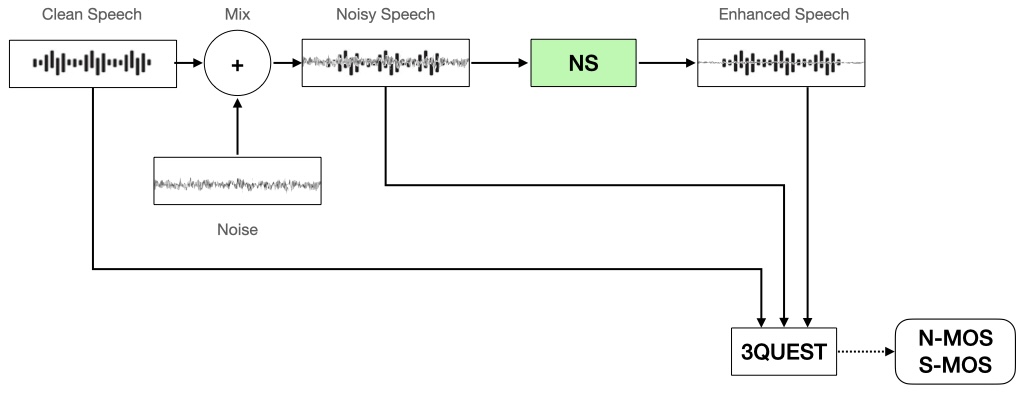
- 3QUEST: A tool that analyzes three files—Test dataset A (reference, clean speech), Test dataset C (clean speech + noise = noisy speech), and the output of the NS module (enhanced speech)—to measure the degree of speech distortion and noise suppression capability
- NS module: The NS module being measured for performance
Measuring NS performance
We measure NS performance through the following procedure:
- Input Test dataset A (clean speech) and Test dataset B (noise) into the NS module to create Test dataset C (noisy speech).
- Input the NS module's output (enhanced speech), Test dataset A, and Test dataset C into the 3QUEST measurement tool to measure N-MOS and S-MOS.
- Check the distribution of N-MOS and S-MOS scores by scene/SNR/level and evaluate the performance of the NS module.
Conclusion
Our team always has and will continue to systematically evaluate and improve the performance of our NS technology. By conducting extensive tests in various environments and using reliable evaluation metrics, we establish a technical foundation to provide users with the best voice call experience. We will continue to invest in research and development to enhance communication quality, ensuring that users can enjoy clear and clean voice calls in any environment.